Solutions

How you benefit

Resources

About

Solutions

How you benefit

Resources

About

Search…

/

Raptor App

/

Calculating Impact of Anomalies & Power Factors

Calculating Impact of Anomalies & Power Factors

Calculating Impact of Anomalies & Power Factors

Calculating Impact of Anomalies & Power Factors

Calculating Impact of Anomalies & Power Factors

Calculating Impact of Anomalies & Power Factors

The Findings table of the Raptor Maps report provides insight into the impact of anomalies on solar-site power production:


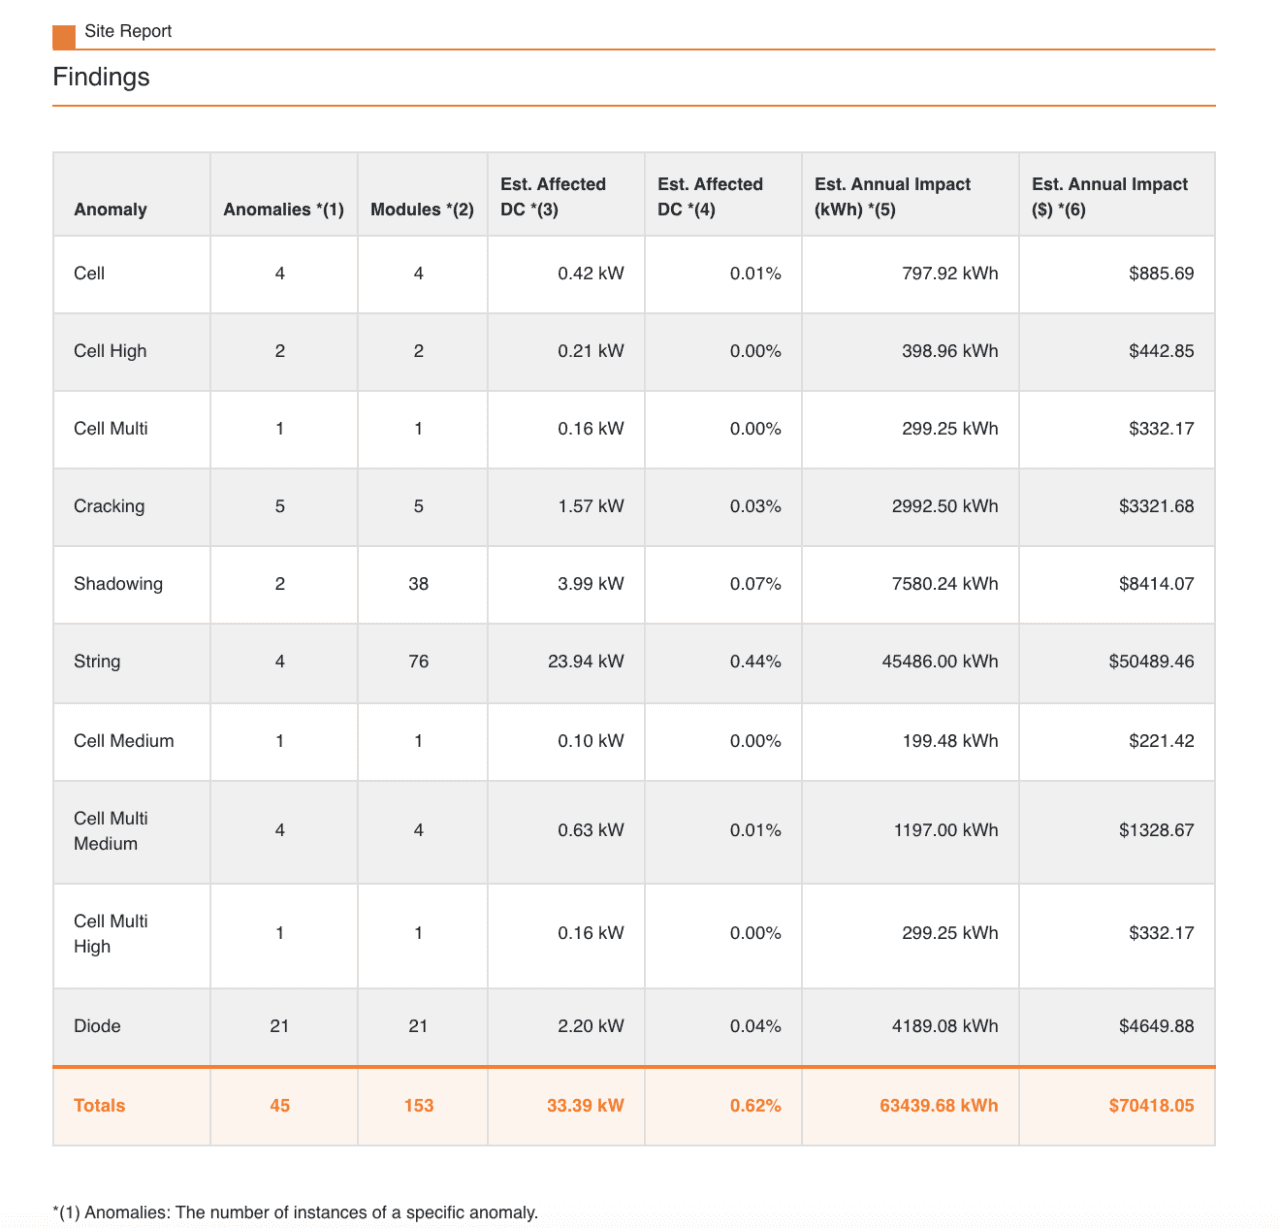
For each anomaly type, the table calculates the estimated impact by multiplying the number of modules affected by the peak power of the solar module at STC (Standard Test Conditions) and a power factor ranging from 0 to 1 (specific to the anomaly).

  • Each cell anomaly impacts the power of the associated module, so for each cell anomaly, there is an associated impact on the module, represented by the number of modules affected.

  • The peak power of the solar module at STC takes into account the specific module installed at the site, as the standard output of a module (in Watts) varies by manufacturer and model.

  • The power factor serves to reflect that, for example, a string outage will have a much greater impact on overall power production than a cell outage would have.

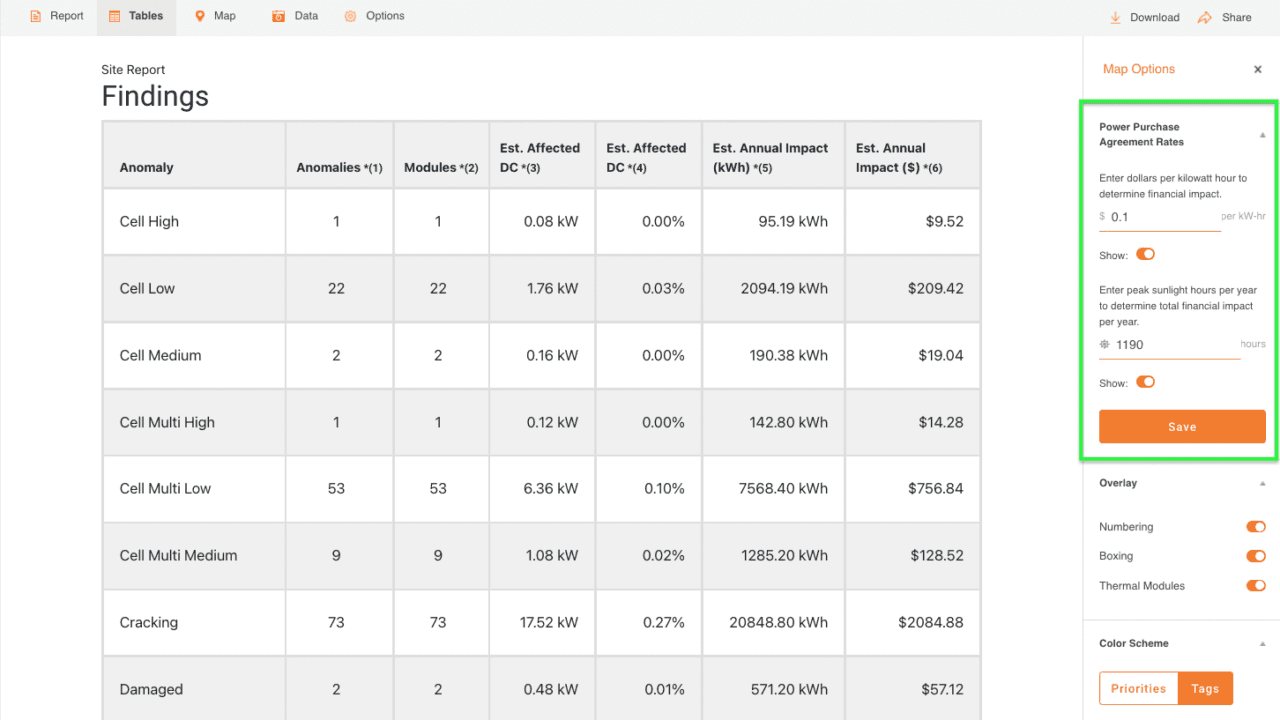
Please update your specific Purchase Power Agreement Rates (PPA) and Peak Sunlight Hours in Map Options to get the most accurate impact calculation.


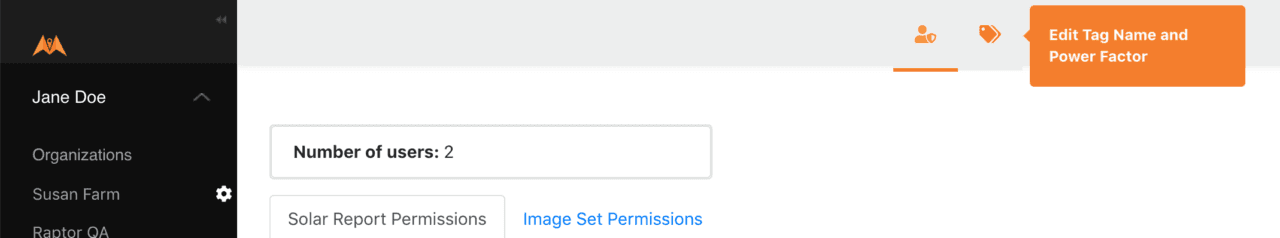
To review or adjust the power-factor default values, click on the down arrow to the right of your username. Then click on the cogwheel.

Note: This action requires administrator privileges.

Once you are on the admin page, click on the tags icon on the left:


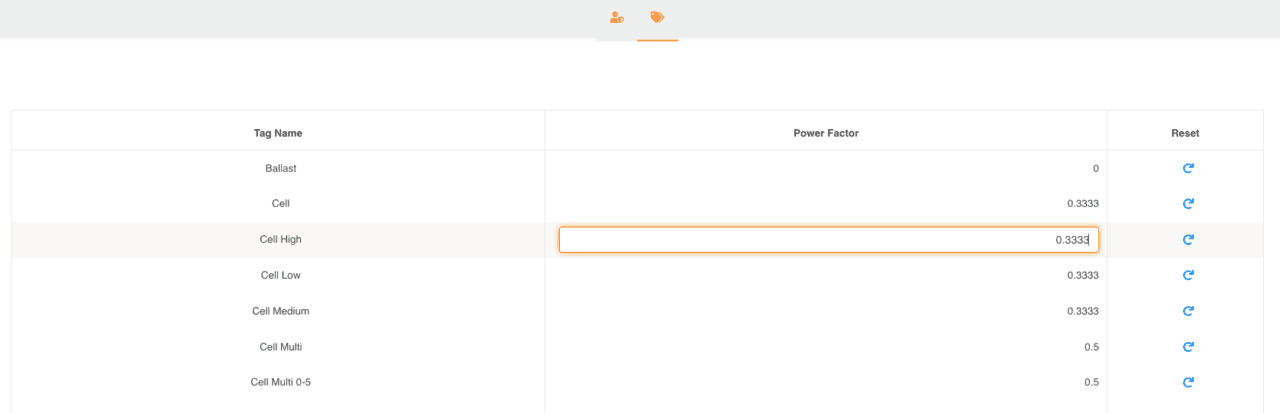
A page displays the default power factor for each anomaly:


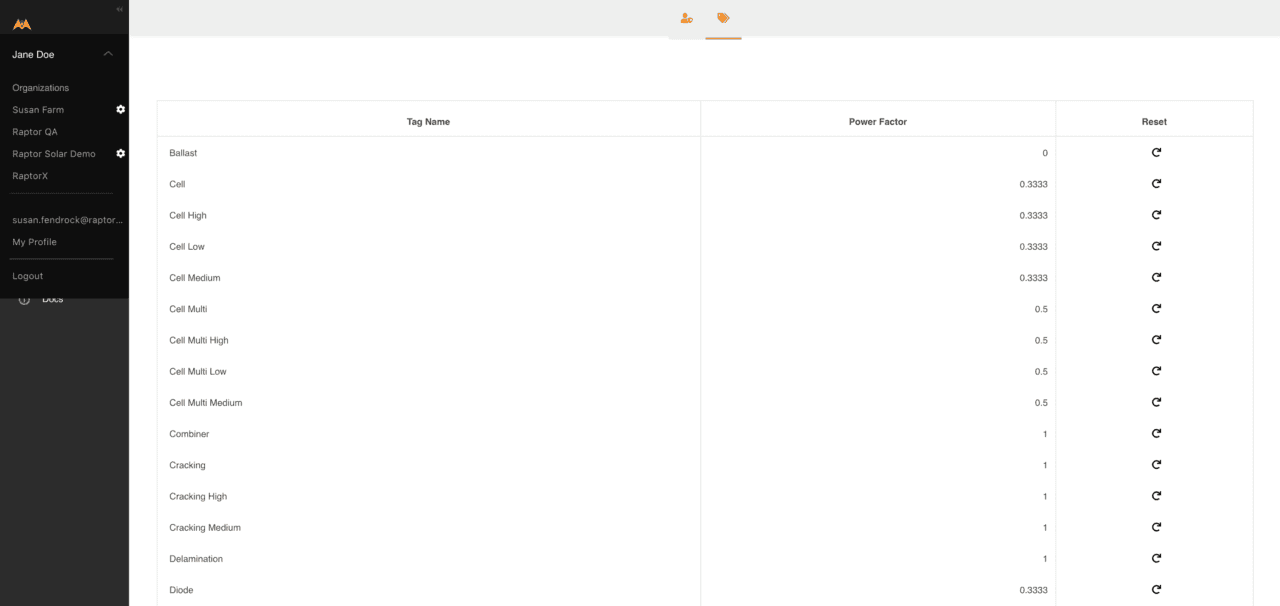
If, in your experience, anomaly types have a higher or lower impact on affected power, adjust the power factor to more accurately estimate impact.


Note: If you are managing solar inspections for multiple clients, any adjustments you make to power factors will change the affected power calculations associated with the Findings table for all new and existing reports.

© 2023 Raptor Maps, Inc.

444 Somerville Ave.
Somerville, MA 02143

Stay Up to Date

Subscribe to our newsletter and stay informed about innovations in solar asset optimization, deploying robotics for solar, our research and testing with OEMs, the latest in our product development, and more.

© 2023 Raptor Maps, Inc.

444 Somerville Ave.
Somerville, MA 02143

Stay Up to Date

Subscribe to our newsletter and stay informed about innovations in solar asset optimization, deploying robotics for solar, our research and testing with OEMs, the latest in our product development, and more.

© 2023 Raptor Maps, Inc.

444 Somerville Ave.
Somerville, MA 02143

Stay Up to Date

Subscribe to our newsletter and stay informed about innovations in solar asset optimization, deploying robotics for solar, our research and testing with OEMs, the latest in our product development, and more.

© 2023 Raptor Maps, Inc.

444 Somerville Ave.
Somerville, MA 02143

Stay Up to Date

Subscribe to our newsletter and stay informed about innovations in solar asset optimization, deploying robotics for solar, our research and testing with OEMs, the latest in our product development, and more.

This website uses cookies

This website stores cookies on your computer to track usage across media in accordance with our Privacy Policy.

This website uses cookies

This website stores cookies on your computer to track usage across media in accordance with our Privacy Policy.

This website uses cookies

This website stores cookies on your computer to track usage across media in accordance with our Privacy Policy.

This website uses cookies

This website stores cookies on your computer to track usage across media in accordance with our Privacy Policy.

This website uses cookies

This website stores cookies on your computer to track usage across media in accordance with our Privacy Policy.