Posted On 4/23/20

Raptor Maps recently released a case study that reports on five heavily impacted sites owned and managed by a large, U.S.-based asset owner. The owner’s solar portfolio totals more than 410 MW of PV assets across the United States. This case study analyzes five PV systems of over 280 MWs, ranging in size from 1 to 200 MWs, and site locations distributed across the U.S. The data capture (aerial inspection) and analysis (data processing and deliverables) was performed via a mixture of internal drone operations by the O&M subcontractor and turnkey aerial services delivered via Raptor Maps. The article below is an overview of each PV system covered in much greater detail in the full Portfolio Case Study.
0.86MW Rooftop Solar PV System in New Jersey
This rooftop PV system was inspected for the asset owner by Raptor Maps’ local turnkey services. The inspection took one hour to complete including set up, flight, and demobilization. This inspection uncovered 4 hot cells, 6 cracked modules, and 1 offline inverter. These anomalies were impacting more than 5% of the site’s production capacity and estimated to result in $1,800 of annual revenue loss if not addressed. Performing the rooftop inspection via aerial thermography prevented any inspection related injuries and greatly minimized the amount of time required by the field technicians to be onsite for their inspection and repairs. The O&M subcontractor utilized Raptor Maps’ platform and the detailed anomalies map to quickly identify the modules and inverter requiring a further look and send the exact number of repairmen and supplies to remediate all issues.
6 MW Ground Mount DG Solar PV System in Minnesota
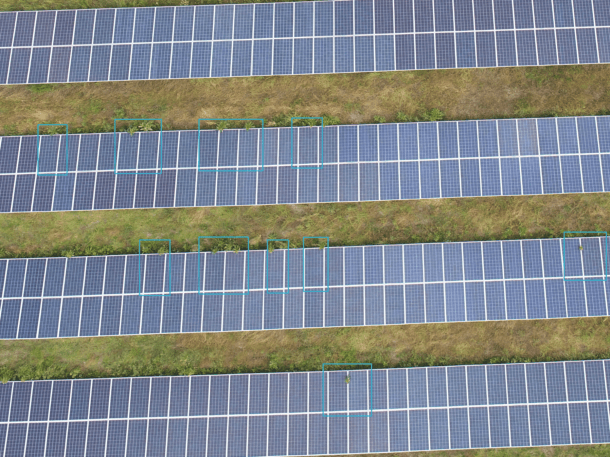
This 6 MW PV system was inspected as part of the annual preventative maintenance scope of work using Raptor Maps turnkey services and local, professional, and experienced drone pilots. The inspection uncovered 490 anomalies, categorized into 16 anomaly types, and amounting to 2,853 affected modules. Instances of shading due to the tree line was one of a few major issues identified by the drone inspection, impacting the performance of more than 2,200 modules. Equipped with this data, the O&M team was able to quickly and accurately create a detailed plan to resolve all major PV system anomalies causing performance issues and impacting revenue.

13 MW DG Solar PV System in South Carolina
This site was inspected by the O&M subcontractor responsible for operating and maintaining this plant. The O&M team had built an internal drone program in 2019. They found the large amounts of data generated by the drone inspection difficult to analyze and organize and began using the Raptor Maps data-processing and reporting platform shortly after launching their drone program. Using Raptor Maps’ Flight Guidelines and Data Requirements, the O&M’s internal pilot managed all data capture (flights) and uploaded the imagery for automated data processing and report generation. The thermal drone inspection and reports uncovered 1,826 anomalies, across 9 categories, totaling more than 2,300 affected modules. The final reports identified and localized 10 malfunctioning strings, 379 diode faults, and over 400 cases of vegetation problems across the northwest side. The detailed reports and HD color imagery (RGB) enabled the O&M team to effectively assess all 400 cases of vegetation and is now utilizing Raptor Maps flight guidelines and data processing software to perform regular aerial inspections to maintain optimal site conditions.

79 MW Utility-Scale Solar PV System in Arizona
The O&M subcontractor managing this utility-scale plant, as well as other large solar assets in the region, had a very tight timeline to complete all aerial thermography inspections before their site visits. Though this O&M subcontractor had an established internal drone program, they outsourced the aerial inspection to Raptor Maps’ turnkey services to free up their labor resources for other needed activities. By utilizing our turnkey services, we handled the aerial inspection, data analysis, and delivered them a report, allowing the O&M subcontractor to focus on other sites they managed. Upon inspection completion, the report identified 50 inverter faults, resulting in over 4% of annual production loss if left unrepaired. The O&M team knew that the site was facing inverter issues due to internal monitoring signals, but the exact number and locations were unclear. The O&M team prioritized their time onsite to resolve the numerous malfunctioning inverters and were able to reduce labor costs by deploying only the necessary number of technicians and resources to resolve all major issues.
199 MW Large Utility-Scale Solar PV System in California
This utility-scale PV system’s O&M vendor was alerted by their system monitoring software that the site was significantly underperforming in various blocks. Due to the large size of the site–more than 1000 acres– and difficulty in locating the string and module-level faults using field walks and IV-Curve tracing would be too expensive. In addition to the costs of these methods in both time and labor resources, they decided to use the faster and cheaper drone inspection option. The O&M subcontractor consulted with Raptor Maps regarding what level of aerial inspection would be appropriate for this investigative inspection and chose a two-phase inspection. The first aerial PV inspection would be a high-level, Raptor Overview level inspection to quickly identify and localize major issues impacting performance as well as heavy concentrations of lower priority faults. After the completion of the first phase, the second deployment would be a Raptor Comprehensive level inspection, targeting heavily impacted areas of the site to collect more detailed analytics on the anomalies causing the performance issues. The report identified thousands of performance issues across 6 categories, totaling 3,114 anomalies. There were almost 20,000 impacted modules resulting in over 7 MW of production lost and almost $300,000 of annual revenue loss if left unresolved for the next 12 months. The O&M team utilized Raptor Maps interactive map and a printed out copy of both the .PDF and Excel spreadsheet reports to create a detailed remediation plan. The site manager was able to deploy their team to every anomaly without wasting time locating the box or module. The team was able to resolve all major issues impacting system performance within a few weeks and return the PV system to optimum production levels.

In Conclusion
The client added Raptor Maps’ turnkey services and to support their O&M subcontractors in early 2019. Within nine months, over 340 MW of sites were flown, analyzed, and reported on. They utilized the versatility of aerial thermography and data analysis through both turnkey services and software. In addition, the asset owner decided to add their O&M subcontractors that self-perform drone inspections to their Raptor Maps account. This enabled the O&M subcontractors to upload, analyze, review, share, and host their drone inspection imagery in a central place and access it as needed.

Contact us
Raptor Maps is building the digital foundation for a more resilient and scalable solar. From construction to end-of-life, we are your long-term software partners to ensure your sites are operating as expected and producing reliable energy to support the energy transition.


