Posted On 10/20/17
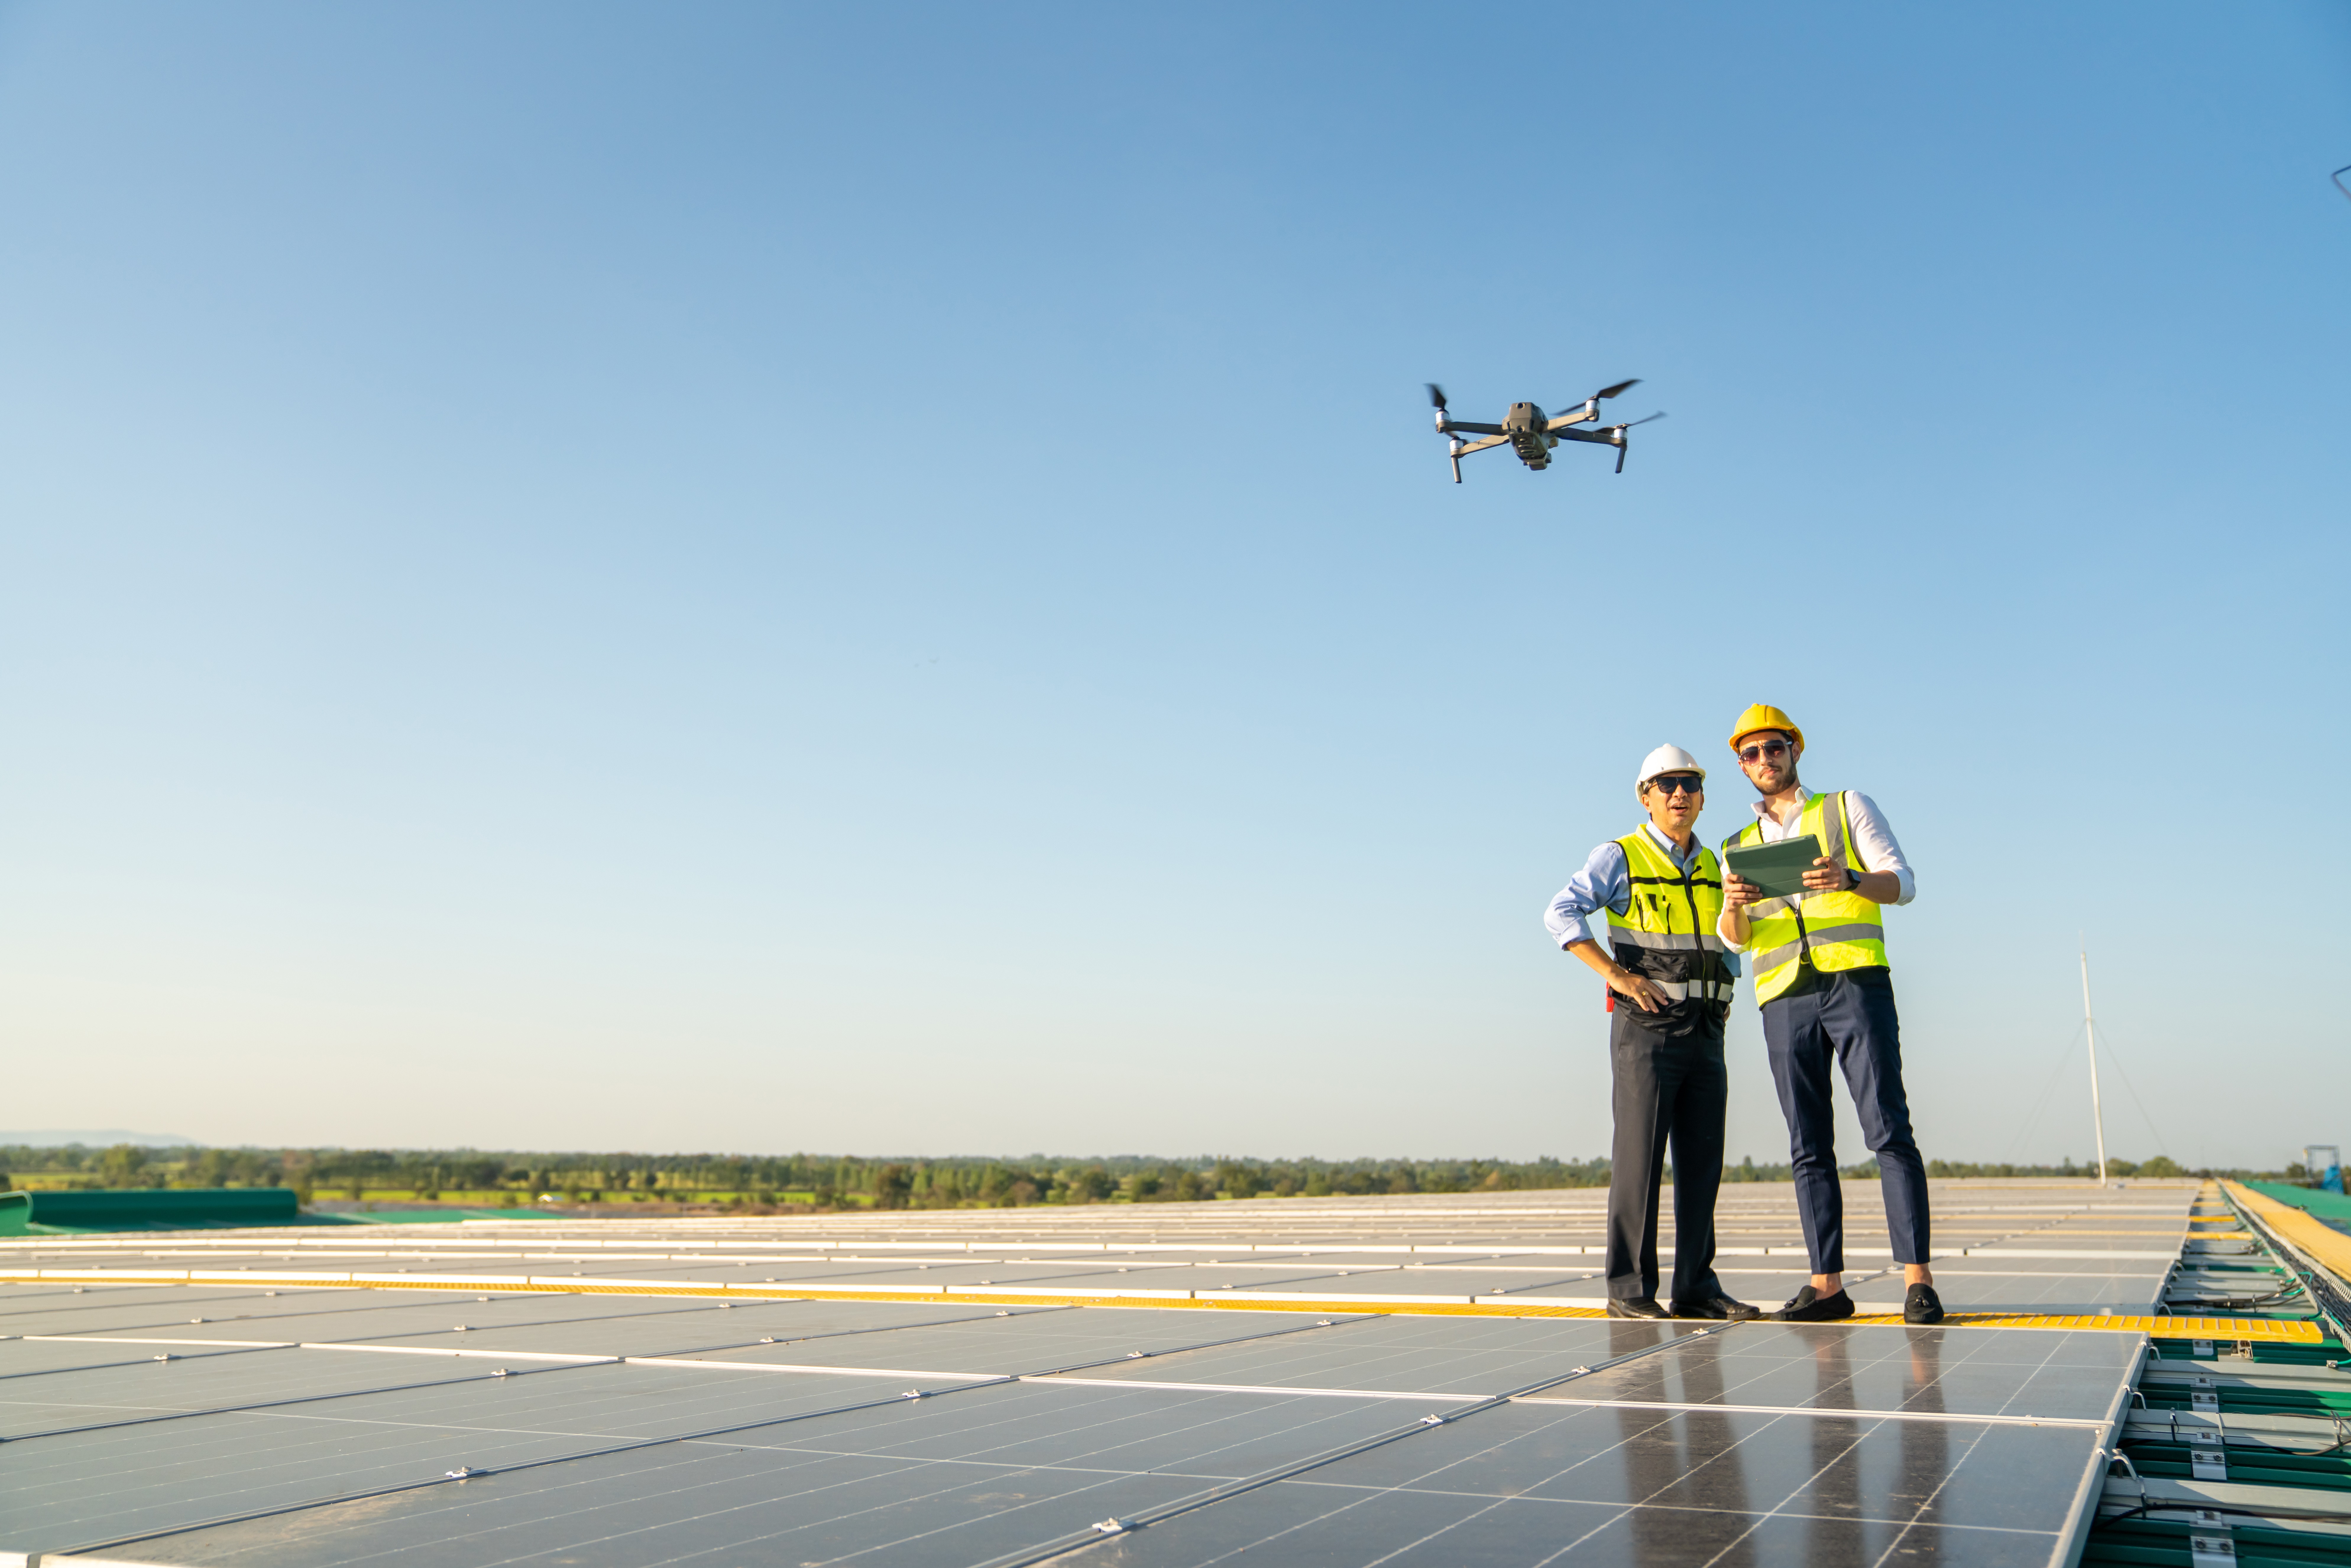
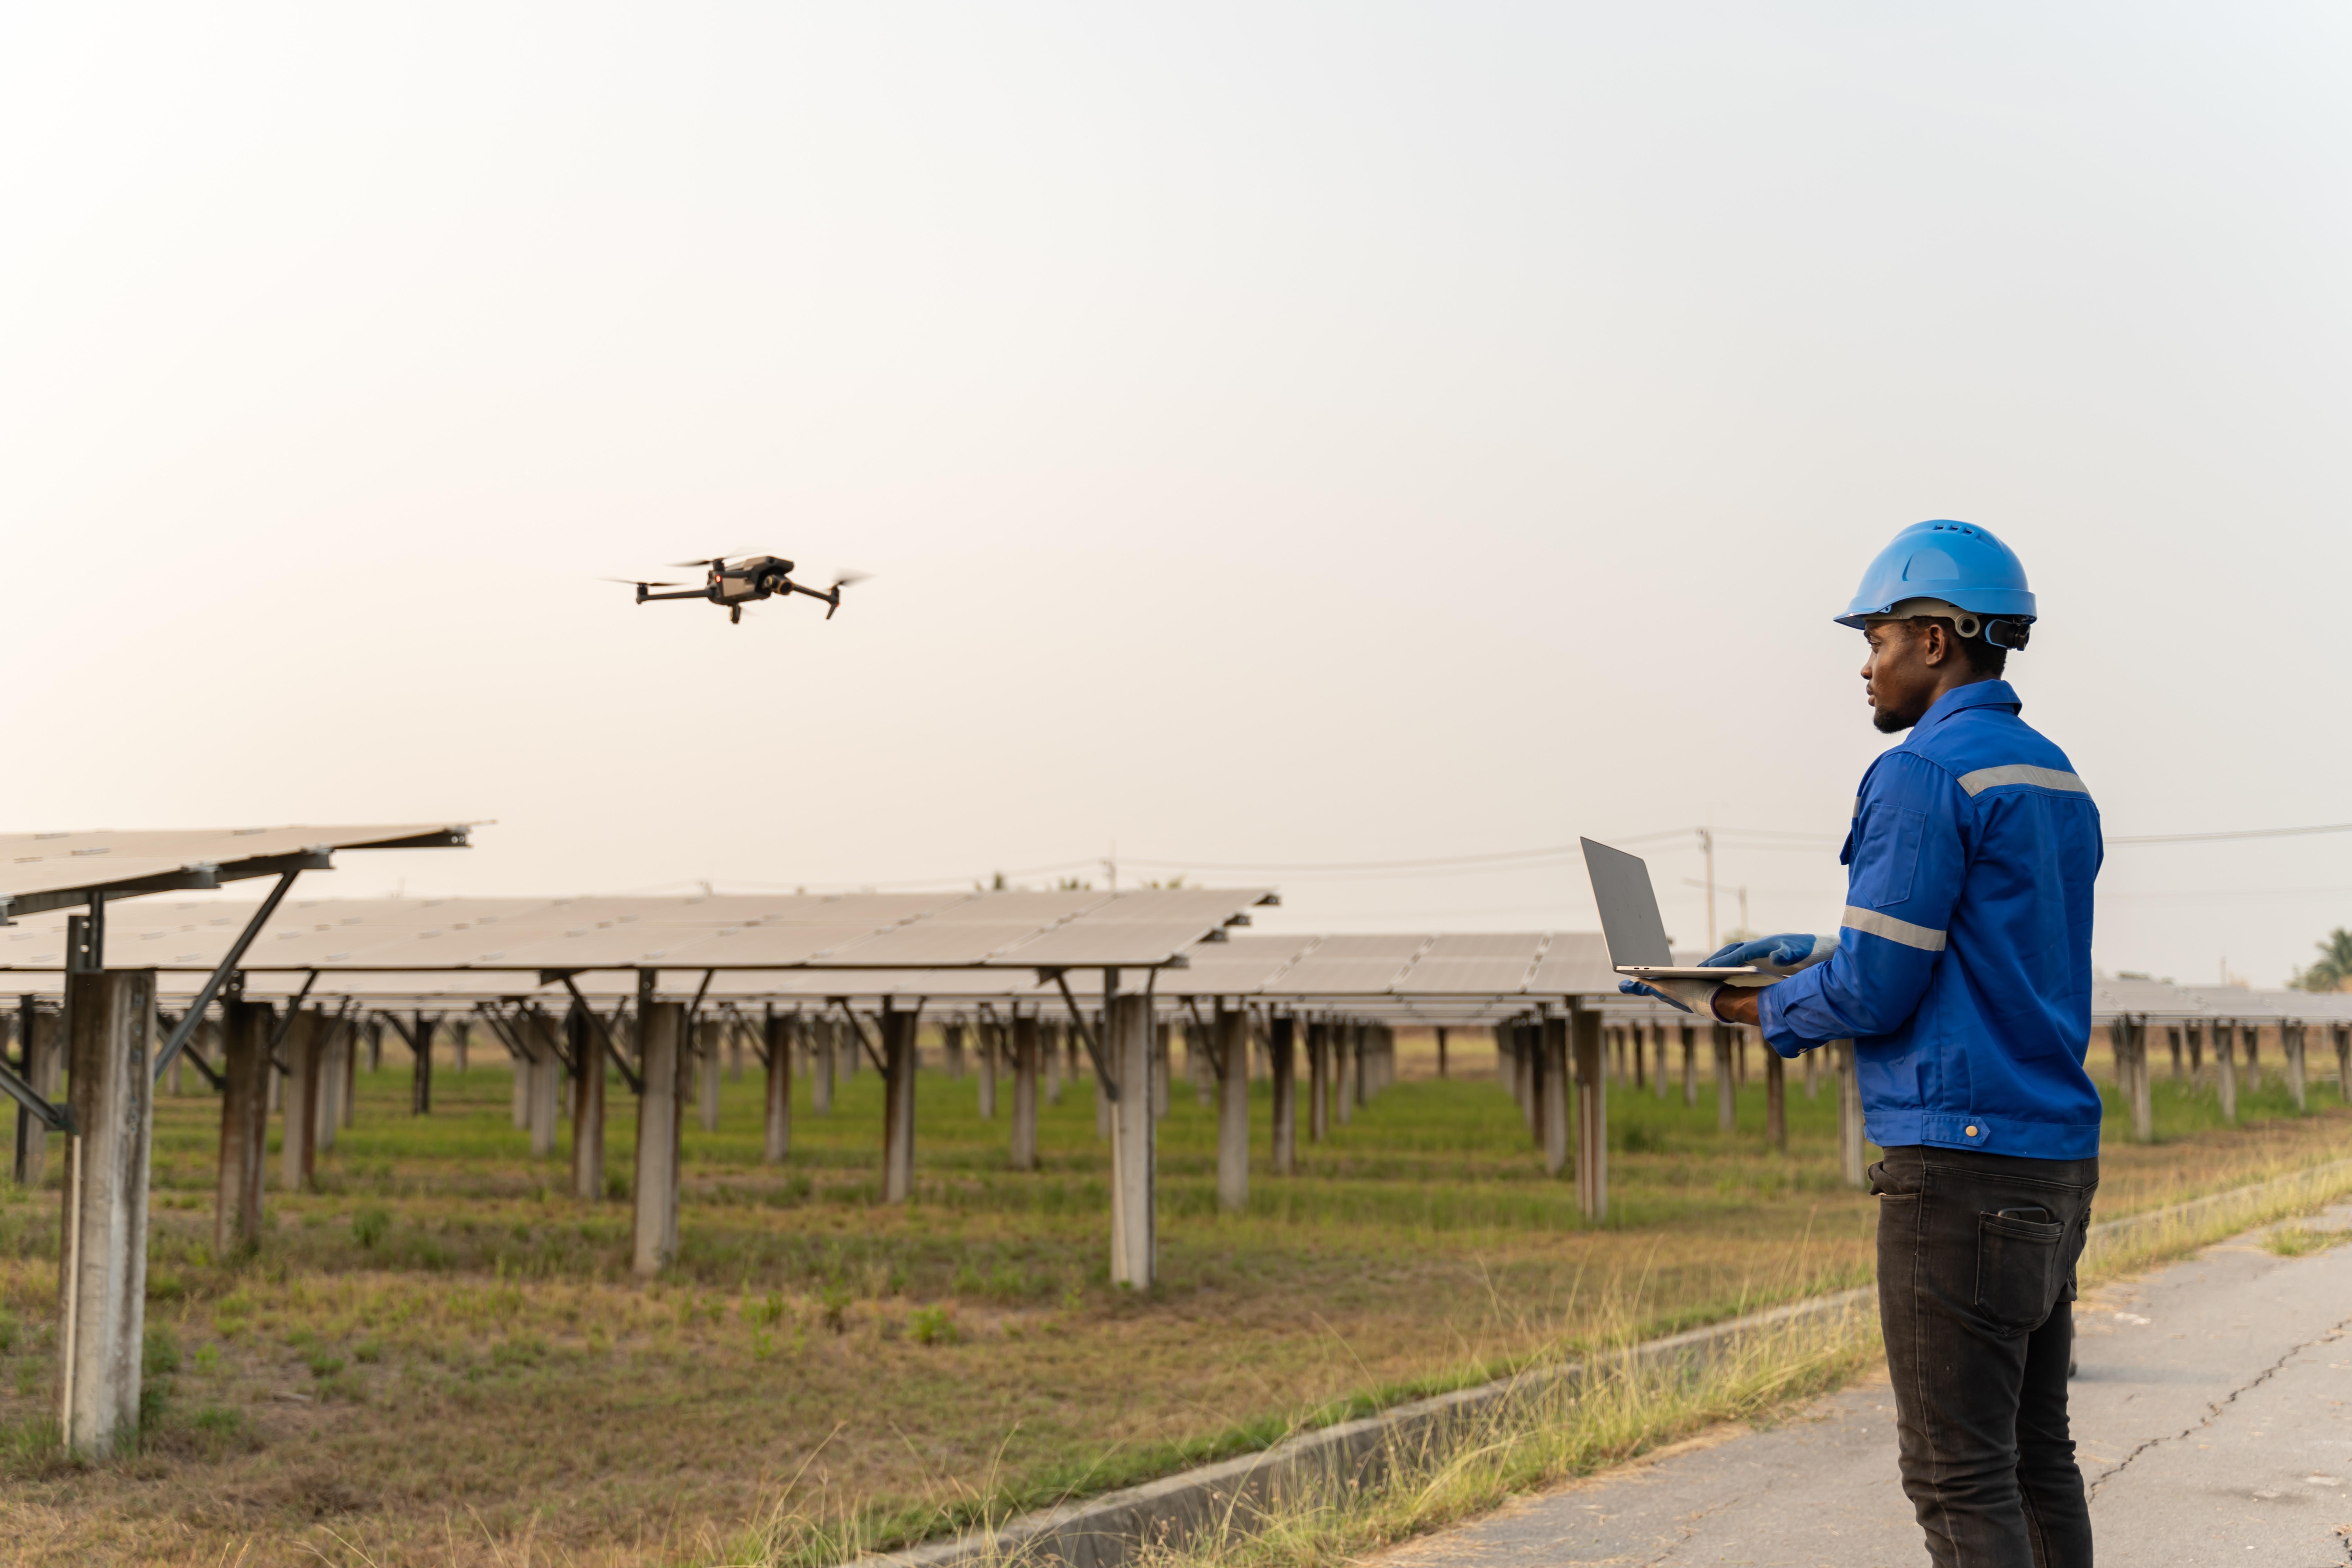
The solar industry is growing exponentially. There are now over 300 GW of capacity in the world1, including 47 GW in the United States2. Operations and maintenance (O&M) providers are responsible for the upkeep of large photovoltaic systems (solar farms), and they are increasingly turning to drones to reduce maintenance costs and increase power generation.
Scroll down to read the full guide.
Why Drones are Useful for Solar
Faults Detected Using Aerial Thermal Imaging
According to the National Renewable Energy Laboratory (NREL), there are 3 major categories of faults that can be detected using aerial thermal imaging3:
Module faults: These include individual hot spots on the cells, diode failures, shattered or dirty modules, coating and fogging issues, and junction box heating.
String and system faults: Wiring issues (reversed polarity, frayed cables), charge controller issues, and inverter and fuse failures.
Racking and balance of system: These are major issues with how the modules are mounted.
Drones are also useful in spotting major site issues, such as vegetation management, poor drainage, and soil erosion underneath the racking.
Communicating with Your Client
It is important to discuss the goal of your solar asset inspection with your client beforehand. Some clients may simply want verification that a newly-built site is operational and are interested in larger defects, such as offline strings and reversed polarity. Others may be evaluating warranty claims, and request a thorough assessment (including cell-sized faults). And some clients may be interested in incorporating drones as part of a longer-term O&M strategy and may wish to evaluate changes in the asset over time.
Report Generation
Solar O&M providers need actionable data. They should be able to hand your report directly to repair crews and their clients. Elements of a good report include:
High-level summary. A summary of defect types and number of defects allows O&M providers to prioritize which arrays need immediate attention. Remember, they are typically responsible for many solar farms.
Localization. Crews need to know exactly which string or module they need to fix. Your report should save them time and allow them to do their job better.
Data reduction. The report should be reduced to the images that highlight specific faults. Most inspections will produce well over 1,000 images. You client only needs to see the important ones.
Raptor Maps prepares reports for solar asset owners and maintainers. Send us your aerial thermal imagery, and we take care of the rest.

Scroll up to download the Solar Farm Inspection Report
Pricing Solar Farm Inspections
Drone service providers think in terms of acres, but solar asset managers pay for services by the megawatt (MW). Older solar installations typically require 7-9 acres/MW, while newer installations only need 5 acres/MW. You should price according to the nameplate capacity, which will typically be in DC power at peak wattage (MWDC). You can read more about DC-AC and conversion losses here.
Thermal Imaging Equipment
Your thermal camera should have a 640 x 512 resolution with a 13 mm lens. A shorter lens like the 9 mm has a slight fisheye effect, and we have to apply a correction factor to localize defects. 19 mm lenses have too narrow of a field of view for this application. You should set the camera to capture radiometric JPEGs (R-JPEGs).
You may want to consider a camera setup with both RGB and thermal, such as the FLIR Duo Pro R from a distributor like RMUS or a custom build from ICI. Thermal camera providers in Europe include Workswell and Optris. RGB imagery can be useful for determining the cause of defects (e.g., shattered panels) and may reveal the cause of a thermal anomaly (e.g., debris or bird droppings).
Flight Planning
Altitude
Fly at 300-400 ft. AGL if you want to create a radiometric thermal map of the entire site. This is generally done for marketing purposes or viewing strings that are offline. Fly at 200-220 ft. AGL if you are looking for defects at the string or panel level. Fly at 120 ft. AGL or lower if you are looking for issues with individual diodes or cells.
Overlap
Orient the long axis of your thermal camera (i.e. the 640 pixels) along the string. Use high overlap (in the direction of flight), and low sidelap between passes (enough so you will not miss a string on your next pass). For more information, watch our webinar hosted by FLIR here.
Flight Planning Software
You can use the DJI GS Pro app to execute your mission. If you have the time, “Hover at Waypoint” mode will yield slightly better picture quality (no motion blur). Set the angle of the flight path to be parallel with the strings. Do not simply outline the entire solar farm and press “go.” Most large solar installations have large sections with “natural” boundaries that can be flown with 1-2 batteries. Several flight planning apps (including DJI GS Pro) offer the ability to upload shapefiles. Raptor Maps can provide you with several 1-battery shapefiles for your entire solar farm in advance of your flight.
Glare
High levels of solar irradiance (i.e. a sunny day) are good. The sun accentuates the difference between defective and normal components. Modules that are functioning properly convert this solar energy into electricity, while malfunctioning modules heat up.
With the sun, however, comes glare. Glare will cause a “whiteout” effect on your images, as the panels will reflect the sun right into your camera. To avoid this, the best times to fly are morning and later in the afternoon. If you are flying over a system with fixed-tilt racking, do not match the angle of the panels with your gimbal.
Checking Your Data
Clients care about the data, not your flight. Use 2 memory cards and swap and backup during each battery change. Ensure that you are collecting radiometric images (R-JPEGs) after each flight. The thumbnails will typically be greyscale, the resolution will be 640×512 (not 1280×720), and you will be able to manipulate the temperature slider in FLIR Tools or the Raptor App. You can also use the Raptor App to check for any gaps in coverage.
Localizing Defects
Several methods can be used to localize defects when we receive the data. If you are flying at a high altitude and looking for large defects (e.g., offline strings), then typically there is enough context in the image to localize the row where the defect is occurring. For module-level defects and smaller, Raptor Maps uses a combination of latitude, longitude, altitude, gimbal heading, and gimbal pitch. If your R-JPEGs do not contain this metadata (e.g., FLIR Vue Pro R), then you will need to provide flight logs. RTK GPS will improve the accuracy but is not a requirement.
Incorporating As-Built Drawings
The “as-built” is the engineering drawing that reflects the actual layout of the solar farm. As-builts typically contain a designation number for each string, and these numbers are (hopefully) incremented in a logical manner. Raptor Maps georeferences the as-built drawings and annotates the defects directly on the document so that solar O&M providers can direct their crews to the specific location of the issue. This also helps keep track of changes in the asset over time.
If your client cannot provide an as-built drawing, then you should survey the site in RGB with 80% overlap and sidelap. The orthomosaic generated from this imagery can serve as the as-built drawing. When using an RGB orthomosaic as an as-built, Raptor Maps can either (i) create a logical numbering scheme to help your clients localize defects, or (ii) you can provide the numbering scheme as seen in-person via the labels on the strings.
Solar Terminology
As with humans, the most basic unit of a solar power plant is a cell. Cells are approximately 6” x 6”, and 60 or 72 cells comprise a module. This is what industry outsiders may refer to as a solar “panel,” but panel can be a confusing term and should be avoided. A string is a group of modules that are wired together. Besides major site issues (e.g., racking issues, flooding, shading, etc.), a string fault is the largest fault that can be observed. It is common for solar asset owners to contract with companies to perform operations and maintenance (O&M) on solar farms to diagnose and fix any issues.
Source: “Snapshot of Global Photovoltaic Markets.” International Energy Agency.↩
Source: “Solar Industry Data.” Solar Energy Industry Association (SEIA).↩
Source: “Best Practices in Photovoltaic System Operations and Maintenance: 2nd Edition.” National Renewable Energy Laboratory (NREL).↩
Contact us
Raptor Maps is building the digital foundation for a more resilient and scalable solar. From construction to end-of-life, we are your long-term software partners to ensure your sites are operating as expected and producing reliable energy to support the energy transition.


