Understanding GSD (AKA Thermal Image Resolution) and How Altitude Affects Your Inspection Costs and Efficiency
This is our second post in the series highlighting some of the most important aspects to successfully inspect a solar farm. The goal of this blog post is to:
Help you be highly efficient and effective with your time and inspection. A properly performed inspection doesn’t need to take longer than necessary to be completed.
Help you learn how to calculate the correct height to perform your solar inspection using the specifications of your camera and the dimensions of the object you are inspecting.
Learn the 3 standard GSDs recommended by Raptor Maps to correctly inspect a solar PV system with a drone.
Asking the Right Questions
It doesn’t matter if you’re running an internal drone inspection program, or if you’re a hired drone service provider, asking the right questions before performing the inspection will save you time and money.
What is the goal of this inspection? Why is this solar farm being inspected? Is it part of a warranty claim? Is the site being evaluated for purchase? Has the site construction been completed and needs to be inspected as part of commissioning? Is this inspection part of the regular preventative maintenance schedule?
Reasons for Asking the Right Questions
The reason for this drone inspection determines how high the drone needs to be operated. Each of the scenarios mentioned previously creates a different inspection goal and determine what level of anomalies need to be identified. For a professional drone service provider, if you don’t fly at the right height, you may have to re-fly, wasting time and money. It pushes off future projects and throws a wrench into your schedule.
As an energy company, if your drone service provider isn’t flying at the correct altitude, the analytics and reports you receive can easily contain inaccuracies and errors. These inaccuracies can include the inspection not identifying all anomalies affecting the production of the solar farm, the identification of false positives, and the misidentification and misclassification of anomalies. For example, multiple cells performing while at an incorrect temperature, but due to the inspection’s incorrect altitude, the anomaly is identified as a diode performing incorrectly.
These inaccuracies and errors lead to lost revenue and production of the site, and technicians spending several hours and days trying to fix the issue. As said in our last post in this series, which you can read here, the hours in the day where thermal inspections can be performed are limited. Due to this, not collecting the data correctly could result in losing the peak daylight hours, postponing your flight and possibly others by hours or days.
Finding Answers
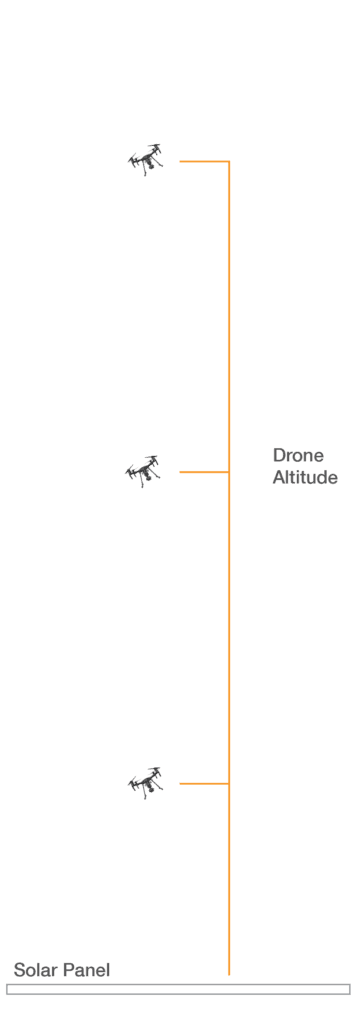
To answer the question, “how high should the drone be flown at”, you need to know what level of detail is required for the inspection. Depending on the amount of detail is needed in the images will help you determine the altitude. For example, an orthomosaic requires a lower quality(resolution) data(imagery) set, whereas a comprehensive report will need much higher quality data (this will be covered more in-depth later). This is the first part of figuring out how to answer this question, you’ll need to know what level of inspection is needed. Once you’ve concluded the quality of data(imagery) that is necessary you can establish what your flight’s altitude should be. This is where the ground sample distance (“GSD”) comes in.
GSD Explained
The GSD specifies the level of detail of the inspection. This relates to the number of pixels that exist within a distance measured on the ground. A smaller GSD equates to more detailed imagery, and in turn higher quality data. Knowing what GSD is required for the flight is what will save time and money.
GSD(height) = (Camera Sensor Height mm x Flight Height m x 100) / ( Camera Focal Length* mm x Image Height** px) =___cm/px
Sensor Height- the physical size of the camera’s image sensor measured in millimeters, not pixels
Flight Height- the altitude in which the drone flies above the ground, measured in meters
Focal Length- tells you how much of the scene in front of you will be shown in the camera through magnification, measured in millimeters
Image Height/Width- the dimensions of the picture, measured in pixels
**Camera specifications can quickly be found on the camera’s packaging, your manual, or the camera vendors’ website.**
Please enter and submit your email below to receive the ‘Solar Asset Inspection Analytics and Reports’ one-sheet.
GSD and Raptor Inspections
An overview, where the smallest visible feature is a solar PV module is 15.0 ± 5.0 cm/pixel. PV Modules range in size but the most common module dimensions are 1.95m x .99m (77in x 39in).
A standard solar inspection, where the smallest visible feature is a cell and cell anomalies is 5.5 ± 0.5 cm/pixel. At this GSD, the thermal camera will still capture three pixels for each solar PV cell. Capturing data at this level provides the client with a report that is detailed enough for warranty inspection.
Meeting IEC Standards
A comprehensive inspection, where the absolute temperature accuracy can be identified requires 3.0 ± 0.5cm/pixel which complies with the IEC standards. The IEC stands for the International Electrotechnical Commission, the global leader in the international standards and conformity assessment body for all fields of electrotechnology. They create regulations to be followed and practiced in the drone community. The ground sample distance of 3.0 ± 0.5cm/pixel meets the standards and allows the data to be captured for top quality detail. This is widely accepted around the world for thermographic inspections of solar PV modules.
After calculating these, you take the greatest number of the two, this is because when you project a pixel on the ground they’re not always perfectly square.
GSD and the IEC
To help explain we’ll use this example, the IEC states that a minimum of 5 pixels per cell are required for thermal surveys and since a cell is usually 150mm x 150mm we know that a GSD of 3 cm is required (see image 1B below). For example, let’s say you’re using the Zenuse XT2 with the 13 mm radiometric thermal lens, recommended lens size by both FLIR and Raptor Maps for solar PV inspections. To comply with the IEC standards of 3cm/px the drone must be flown lower than 24m/72ft.
Correctly calculating the required GSD prevents drone service providers from needing to perform re-flys, and gives solar farm owners actionable data to increase energy production. Being beneficial for every party.
Visual Explanation of GSD
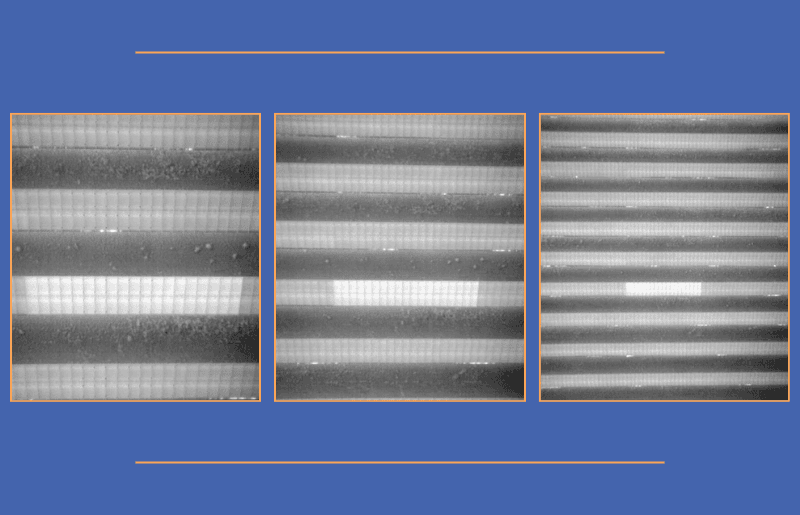
The GSD can be difficult to imagine at first glance, so we’ll explain through visuals. We’re going to give you examples of these visuals in both thermal and RGB, as well as what it should look like at three different heights and resolutions.
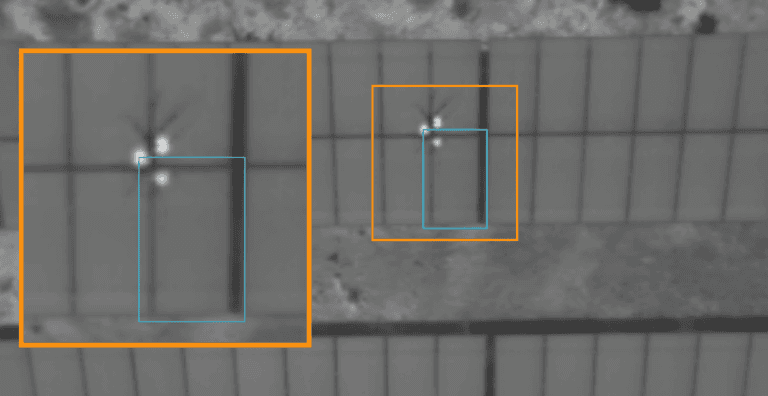
Image 1A: Thermal Image with 15cm GSD, making anomaly identification difficult
This is a thermal image taken of a module that has some kind of anomaly. However, due to it being taken with too high of a GSD, the resolution isn’t clear enough to accurately determine the issue. The resolution is so low that the anomaly is only registered on one of the modules instead of all 4 that are affected. The two most likely possibilities of the anomaly are vegetation or cracking. This anomaly, that spans the 4 modules, could be caused by the modules be struck by something in the corners that meet or from vegetation growing through. Causing the issue of not being able to determine the priority of the anomaly. Vegetation is less severe and, more importantly, less costly of an issue, unlike cracking.
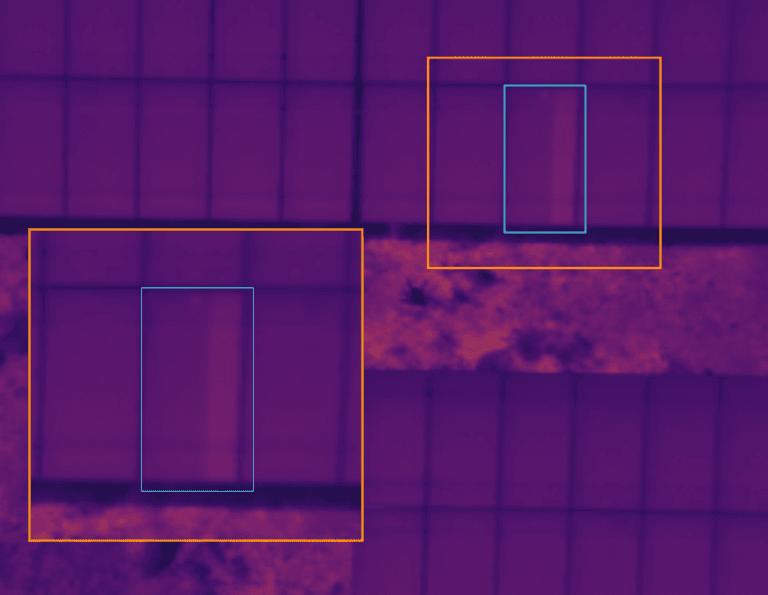
Image 1B: Thermal imagery taken at 5cm GSD and clearly shows anomaly.
This image was taken at a lower GSD, and it shows in the clarity of the picture. The anomaly is easily identified as a diode and the solar farm will be immediately aware of the priority of the problem. This image was taken to the IEC standard, as all thermal images should. If this level of GSD was used on the previous picture, the image would pass the data requirements and the anomaly would’ve been easily identified.
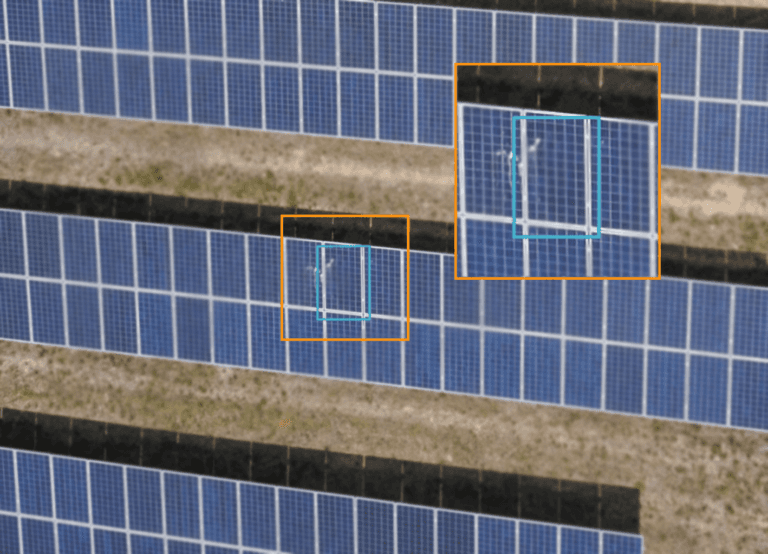
Image 2A: Visual (RGB) image taken too high for the camera’s specifications resulting in high GSD
In this picture, you can see that there is an anomaly on the solar panel, but it isn’t clear enough for identification. The anomaly’s location in the solar farms is clear because of metadata, but the priority, type of anomaly, and impact on energy production are not. This is where miscalculation or neglect to calculate all together will disrupt the workflow for everyone, not to mention the loss of money! The problem is preventable and unprofessional. It could be soiling, but it could also be the cause of delamination. If this picture was taken after correctly calculating the ground sample distance, it would’ve been clear.
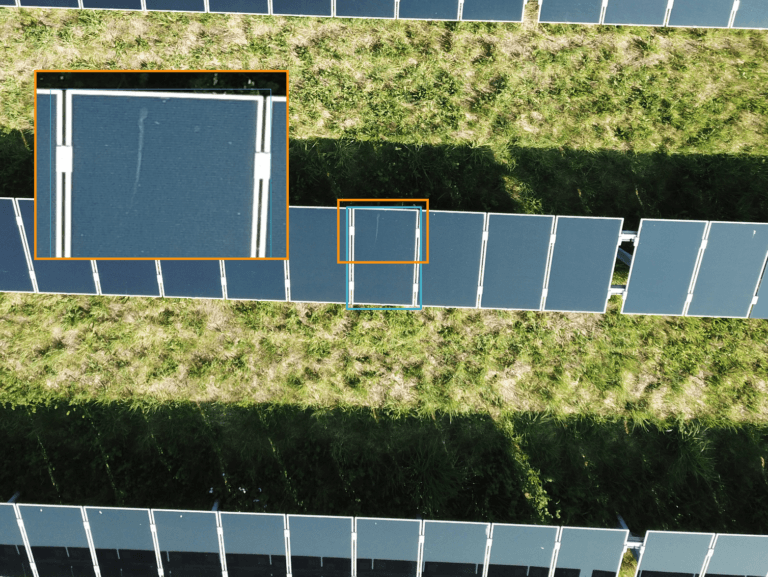
Image 2B: A very clear image taken after calculating ground sample distance
Now, on the contrary, these pictures were taken using a correctly calculated GSD and the change in outcome is clear! The software can detect the anomaly’s correctly and accurately, and more importantly, the identity of the anomaly. This lets our software analyze, prioritize and alert the solar farm owner of the issue. This actionable data will allow the solar farm to fix what needs to be as soon as they’re able to. This saves them, and the drone service provider money because there is no need to re-fly. Not to mention the drone service provider will benefit from being known as a reliable source. What looked to be a crack, a high priority anomaly, was just a bird soiling smudge and will wash off during the next rainfall.
In conclusion, the benefits of flying at the correct altitude are clear. By knowing the data set you’re supposed to acquire, you can calculate your ground distance sample (GSD) to create the best data set possible.
If you would like to learn more about how to inspect a solar farm at the correct altitude please contact us HERE or email us directly through info@raptormaps.com. We can also help you learn more about our software that converts your inspection imagery into final reports that are accurate and easy to use for asset management and maintenance.
Next steps
From the civil engineering on your site down to the wiring on the back of your panels, the Raptor Solar platform provides you detailed, up-to-date data on the conditions and performance of your solar fleet so that your team has the intel they need to do their jobs effectively, quickly, and safely.
