Posted On 3/9/21

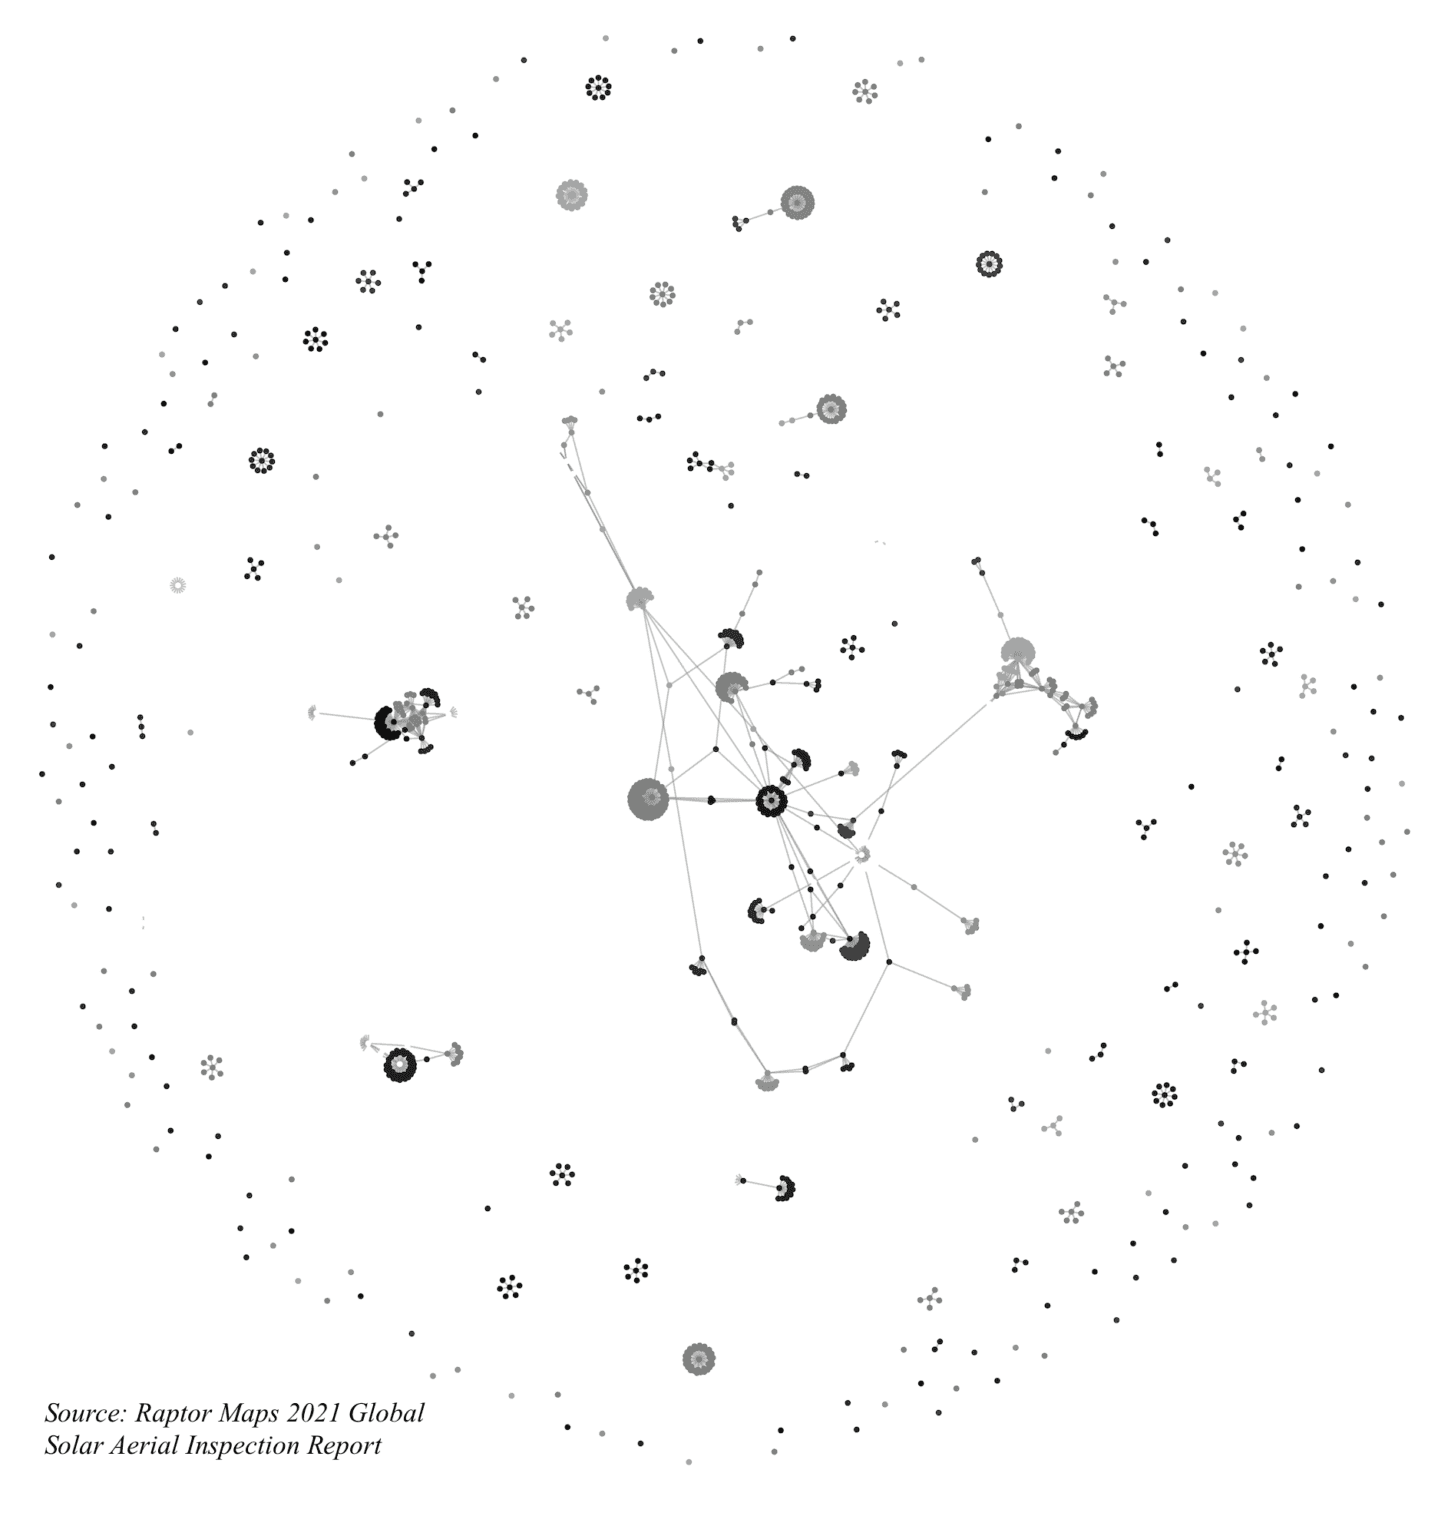
Above is a first-of-its-kind industry network graph illustrating the collaboration between users in the Raptor Maps software on a subset of data. Smaller clusters tend to be sharing reports within an organization, and longer lines indicate collaboration between organizations.
Software company reveals record-high collaboration between users in annual benchmarking report.
BOSTON–Raptor Maps, a leading provider of solar lifecycle management software, released its third annual report on causation and frequency of PV system underperformance. The company utilized its solar data model to query 22 GW of utility-scale and C&I PV systems across 27 countries.This report leveraged data collected by aerial inspection, a technique specified by owners and operators for commissioning, preventative maintenance, and warranty inspections. Aerial inspection fuses site-specific schematics with thermal and color image data captured under specific conditions by unmanned or manned aircraft.The results are available for download here.
“This year, we were surprised that each online report was shared to an average of 22 additional users,” reveals Nikhil Vadhavkar, co-founder and CEO of Raptor Maps. “The data owners are authorizing more counterparties to access raw and synthesized data. In particular, we have seen an increased willingness from module manufacturers and EPCs to leverage this data to provide owners and operators with positive resolutions.
”The study encompassed over 70 million modules, 92 module manufacturers, and 1,126 PV systems. On average, Raptor Maps inspections revealed that 1.9% of power production is affected, compared with 1.6% from the previous year. Classifications included in the study include functional units, such as off-nominal inverters and trackers, environmental conditions, such as shading and soiling, and module-level findings, such as cracking and activated bypass diodes.
The global report comes on the heels of a BloombergNEF (BNEF) report forecasting up to 209 GW of new solar PV installations in 2021. 84% of the modules analyzed in the Raptor Maps report are classified as BNEF Tier One. Industry tailwinds include net zero targets from governments and corporations, a stable supply chain, and overall favorable levelized cost of energy (LCOE). Due to this growth, developers, owners, and operators have increasingly required software and data-driven analytics to meet their financial objectives at scale.
Contact us for more information. Technical information regarding data collection protocols, sample contracts, and API documentation is available in our Knowledge Hub.
Contact us
Raptor Maps is building the digital foundation for a more resilient and scalable solar. From construction to end-of-life, we are your long-term software partners to ensure your sites are operating as expected and producing reliable energy to support the energy transition.


