Posted On 3/22/18
In partnership with FLIR Systems, the world’s largest supplier of thermal imaging technology, Raptor Maps recently hosted a webinar to cover the basics of inspecting solar farms with drones. With 1,500 registered viewers, we reached an unprecedented audience interested in applying this technology to detect issues and optimize asset management.
The entire webinar can be viewed below for anyone who was unable to tune in live. The following are responses to questions that were received during the webinar. Part 1, a summary of the main themes, can be found here.
Webinar Q&A
Should I make a thermal map as the solar inspection deliverable?
Raptor Maps does not recommend creating radiometric orthomosaics (thermal maps) of solar farms as the deliverable for a solar farm inspection. Thermal maps require flights at higher altitudes, resulting in a loss of detail, which is exacerbated by the blending of radiometric images. Thermal maps of solar farms are also unable to provide the detail a client needs in order to identify, classify, and localize issues. The high sidelap required means additional time spent in the field. Raptor Maps has developed its solar software solution to deliver the analytics and reports that solar companies expect from a drone inspection.
Should we take videos or photos to capture images of a solar farm?
We recommend taking infrared and high-resolution color (RGB) photos with your drone.
What flight planning strategy does Raptor Maps recommend to produce the highest quality data?
Infrared images with a high overlap (in the direction of flight) and low sidelap (between passes).
Color (RGB) orthomosaic flight pattern at 250–400 ft to enhance report quality. Required if no satellite image of site.
Exact altitude depends on your camera/lens setup, but a minimum 5 cm/pixel ground sampling distance (GSD) is necessary for cell-level issues. If you are using a multicopter, maintain heading at all times. Fly in a grid pattern either parallel OR perpendicular to the rows. Confirm your images contain metadata (GPS location, relative altitude, etc.) and are free from motion blur and glare.
We recommend using the flight planning app provided by the manufacturer of your drone. This FLIR forum is a great place to learn more about flight planning apps for thermal inspections, link here.
How should we angle our camera for optimal data collection?
Start with your camera pointed nadir (straight down) and tilt up to 20 degrees to avoid glare and get the best view of the modules. However, your camera should not be aligned to the modules straight-on. See this technical note to understand why.
What is the value of the Raptor Maps’ solar software solution?
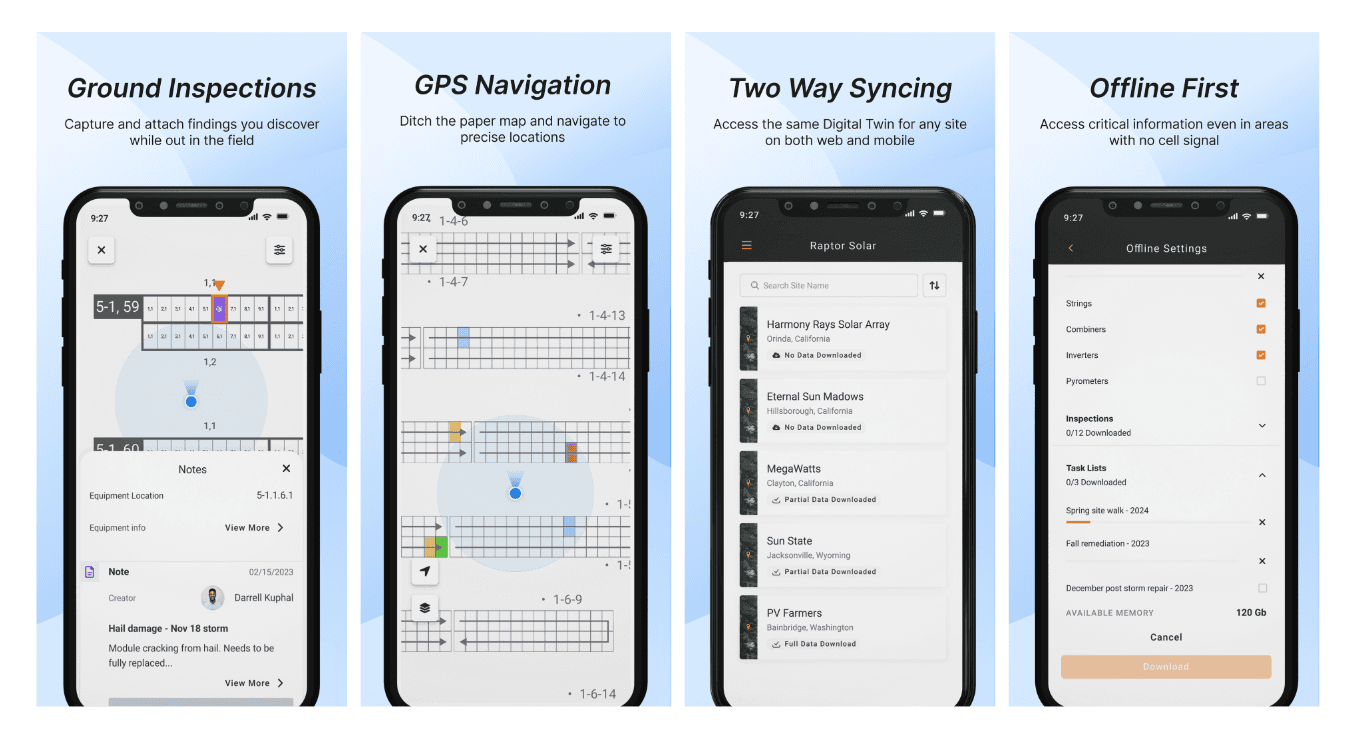
Raptor Maps eliminates the time-consuming process of turning your aerial data into actionable information for solar professionals. Raptor Maps has developed Raptor Solar™, the first Artificial Intelligence (AI) software solution, to help you process thermal images, color images, and site data generated from aerial solar site inspections with drones and/or manned aircraft. The software manages the identification, classification, and localization of every solar farm issue captured in the inspection dataset.
The software analysis includes finding and classifying:
Major electrical issues (inverter, combiner box failure, reversed polarity)
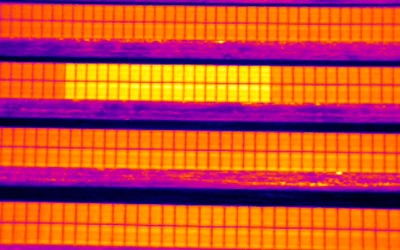
Defect identification at the string, module, and cell level (e.g., activated bypass diodes, shattered and soiled modules, etc.)
Tracker and racking issues
Site issues (e.g. shading, vegetation, flooding, security risks, etc.)
You can learn more about the Raptor Solar™ software here.
What is the thermal certification requirement to conduct these inspections?
There are no thermography licensing requirements required to successfully capture data for qualitative assessments of solar farms. However, it is valuable to have be familiar with thermography basics and understand the science behind these inspections. If you are interested in learning more, we recommend attending a Level 1 Thermography course and/or familiarizing yourself with the science behind aerial thermography with FLIR Delta.
How is the price determined for a solar inspection using drone technology?
There are many variables that impact the costs of performing this inspection, as well as the price that a solar company is able to pay. These variables include: size of the solar farm, the amount of work included in the project (multiple sites, multiple inspections a year, etc.), the location of the site and travel time/distance, the country/region of the drone inspection, the country/region of the solar company hiring for this service, type of client hiring for this service, etc. We strongly recommend structuring costs for this service based on the size of the solar farm and/or size of the total volume of work the client needs done.
How does Raptor Maps present a solar farm inspection report?
We offer a sample PV system inspection report here (link to be updated shortly). Raptor Maps solar software analysis delivers results through an online portal as well as standard digital and downloadable formats including .PDF, Excel, and .KML. You can also learn more about the software’s analysis capabilities here.
Are there any chance of misreadings from inspection results?
Infrared inspections capture effects such as shadowing, for example, which may appear as hotspots or damaged modules from thermal data alone. While the pattern can help to distinguish these types of effects, high-resolution color photos are an important complement to thermal imaging and will help you identify the root cause of issues, and help you avoid delivering false positives to a client. It is important to capture this imagery of the solar farm within the same timeframe/day that you inspect the site with a thermal imaging camera.
What does Raptor maps charge for software/processing?
Raptor Maps solar analysis and reporting software is priced per MWdc of site data processed. The costs include complete post-processing of infrared and color (RGB) data sets, inspection analytics, and comprehensive reports available in digital and downloadable formats. If you need a quote, please contact us here.
Contact us
Raptor Maps is building the digital foundation for a more resilient and scalable solar. From construction to end-of-life, we are your long-term software partners to ensure your sites are operating as expected and producing reliable energy to support the energy transition.


