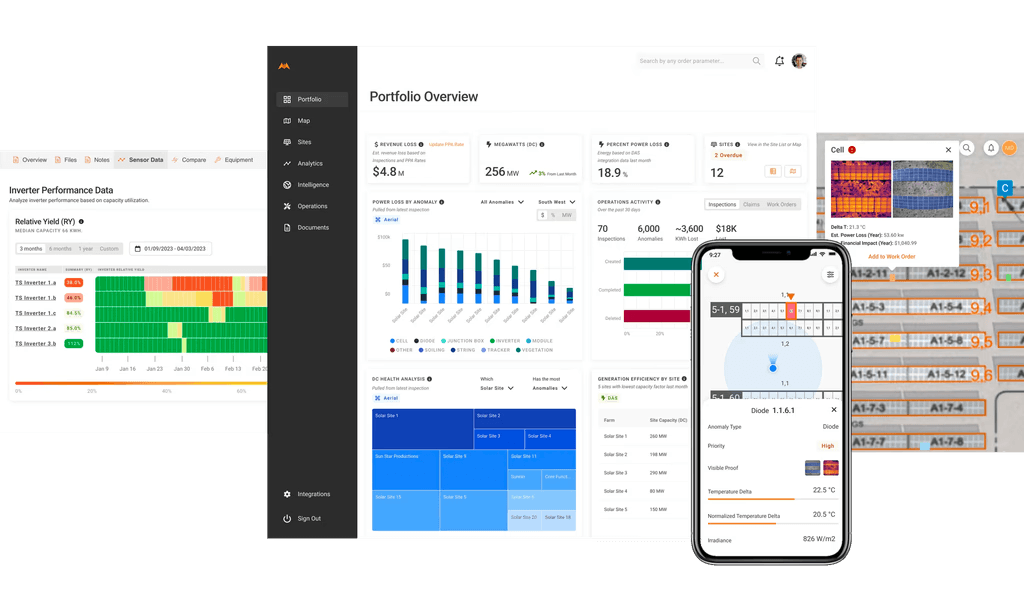
Managing a diverse solar portfolio efficiently requires cutting-edge tools that empower you to make data-driven decisions. At Raptor Maps, we are excited to introduce several new features to our Raptor Solar platform.
These enhancements are designed to streamline decision-making, improve on-site navigation, provide in-depth production analytics, and simplify the onboarding process for new users. Here are all the ways these features can elevate your solar asset management.
Portfolio and Site Dashboards: Smarter Decision-Making Tools
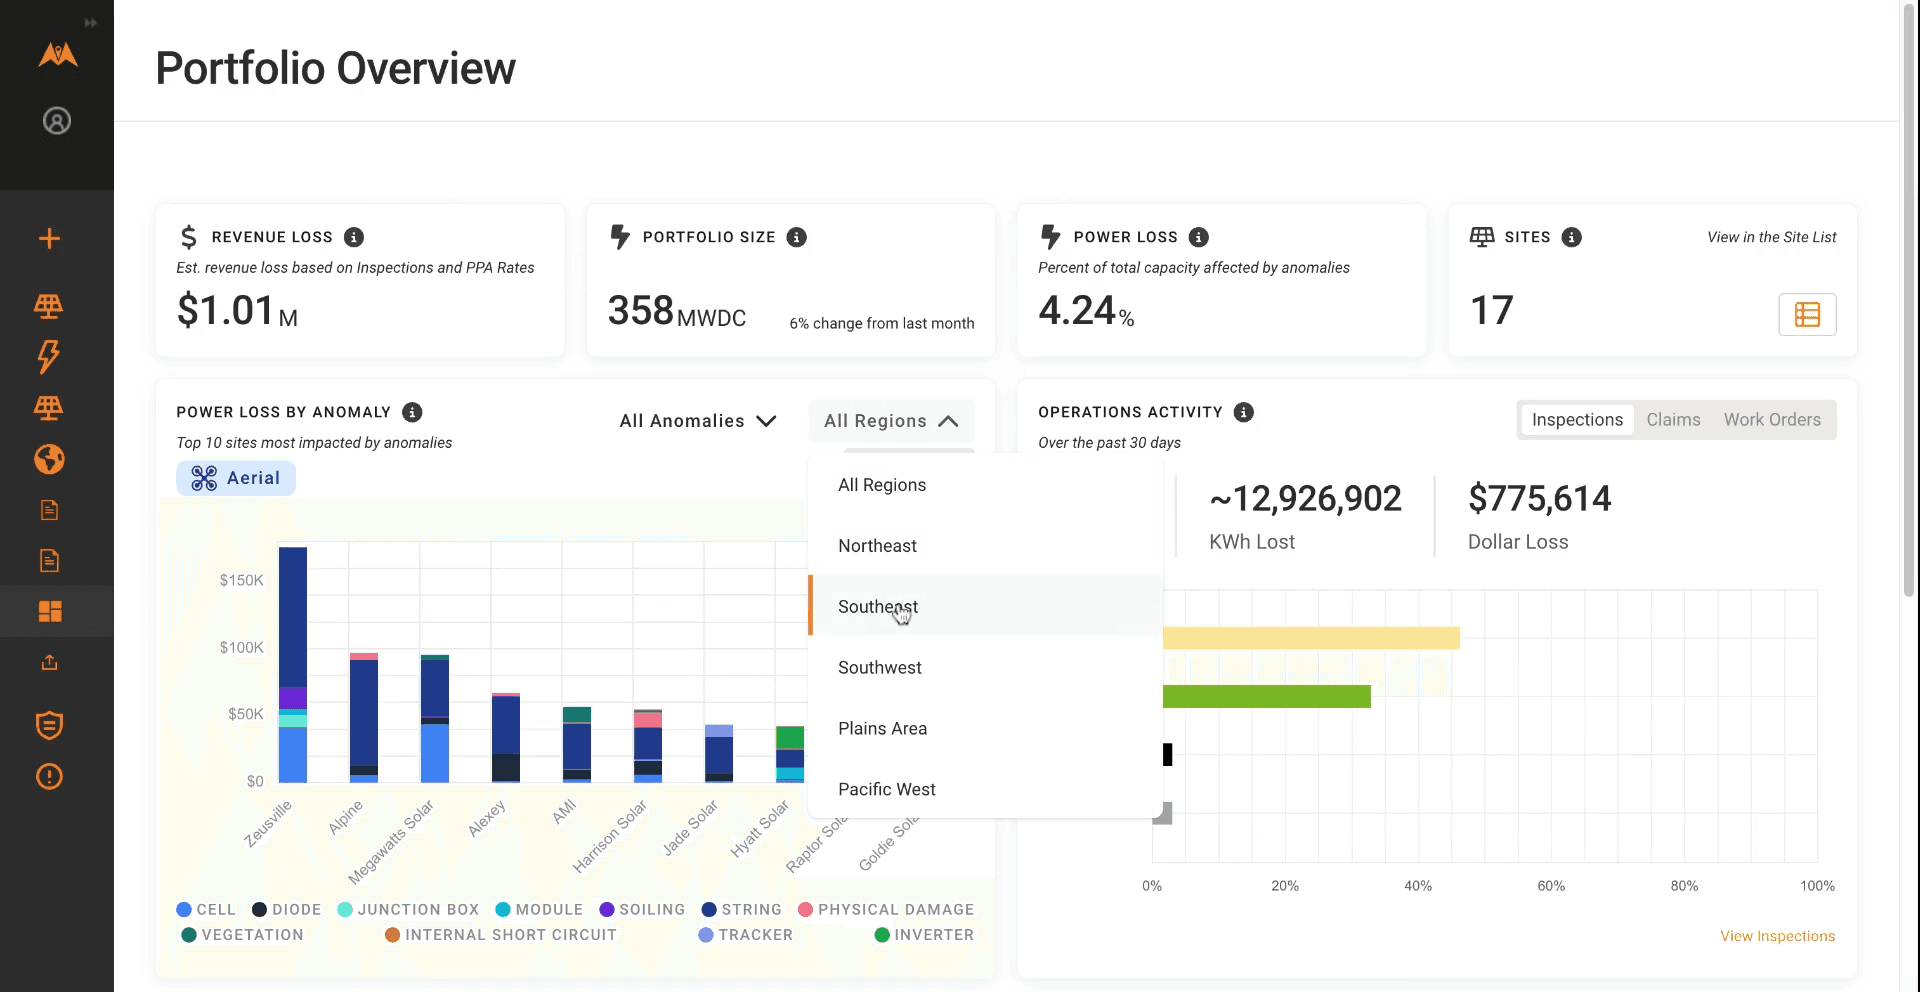
Our new Portfolio Dashboard is a game-changer when it comes to managing your solar assets, so that you can track and make sure you are hitting your KPIs. It offers a clear and concise overview of performance metrics and operational insights to drive decisive action in the field. With this tool at your disposal, you can quickly identify which sites require your attention for optimization and remediation, ensuring your efforts are focused where they matter most. The Portfolio Dashboard provides a bird's-eye view of performance and operations, enabling data-driven actions to improve asset health and project returns.
Additionally, you can easily segment and analyze your data by region, anomaly type, and various other categories, allowing for targeted strategies. The dashboard also allows you to schedule and track the progress of core operational workflows, such as aerial inspections, warranty claims, and work orders - all from a single, user-friendly view.
We’ve also rolled out the same functionality for Site Dashboards, which allow you to drill down into all the same data on a site-specific basis.
Demo them yourself here!
Production Analytics for Inverters: Pinpointing Asset Trends
Our new Production Analytics feature offers a visual representation of inverter performance, facilitating rapid trend analysis and the swift identification of asset degradation. By combining aerial inspection results with a normalized view of power production, you gain a competitive edge in prioritizing maintenance activities.
Production Analytics also provides a fresh spin on classic visualizations by showing inverter yield compared to other inverters on the same site at the same time. Traditional visualizations have simply shown output data, which is highly variable depending on weather and time of day. Our new comparative view, by contrast, identifies long-running performance trends regardless of weather patterns or outages onsite.
Dispatching maintenance teams becomes more efficient after spotting underperformance via Production Analytics and identifying the root causes in inspection reports, ultimately boosting power production in the short and long term. Now, you can easily analyze trends and pinpoint asset degradation without a performance engineer lifting a finger.
New Solar Sites Onboarding: A Smoother Experience
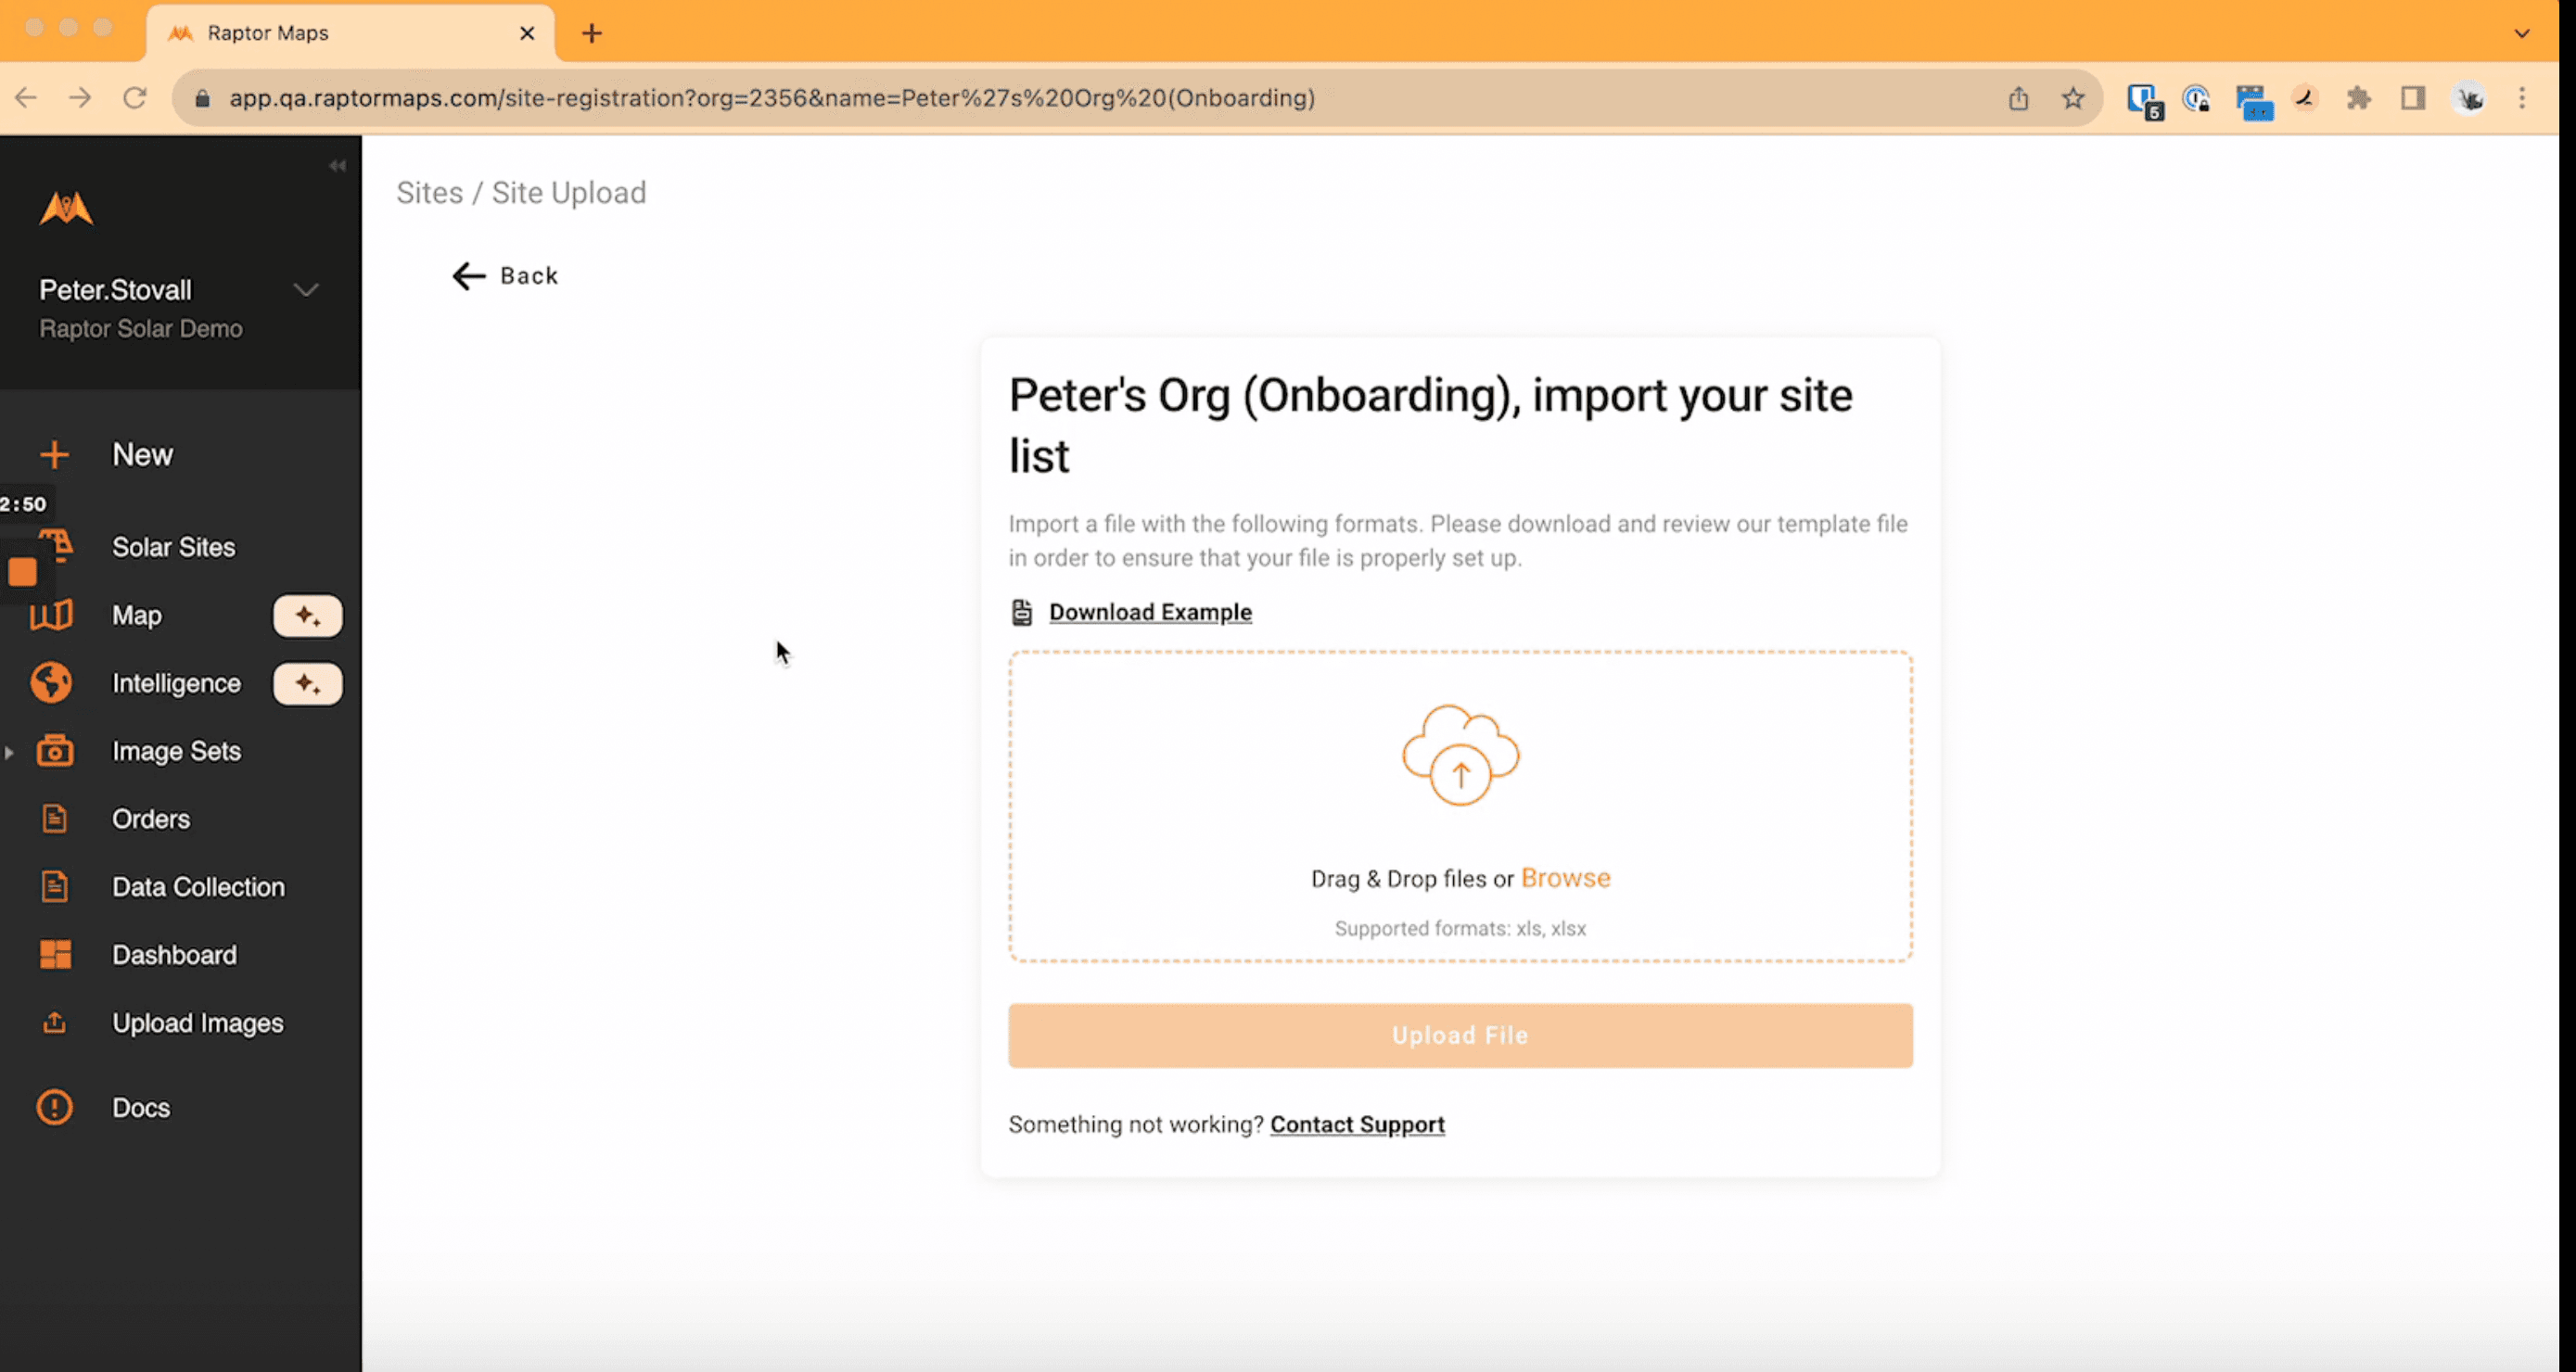
We’ve made it even easier for users to digitize their solar sites with our new site bulk upload flow and our revamped Solar Sites dashboard.
You can now upload your portfolio and sites in bulk through a simple interface, instantly creating new sites in your Raptor Solar account to begin layering on data sources. Check out this quick video to see it in action.
Once you create new sites in your portfolio, our revamped Solar Sites dashboard tracks your progress on the digitization of each site, allowing you to quickly identify which sites are missing the one-click integration with SCADA/DAS systems to enable production analytics, missing equipment digitization, and more. This birds-eye view streamlines onboarding your portfolio into the Raptor Solar platform, allowing you to unlock value quickly and to quickly begin optimizing your assets through the platform.
A Revamped Mobile App Experience
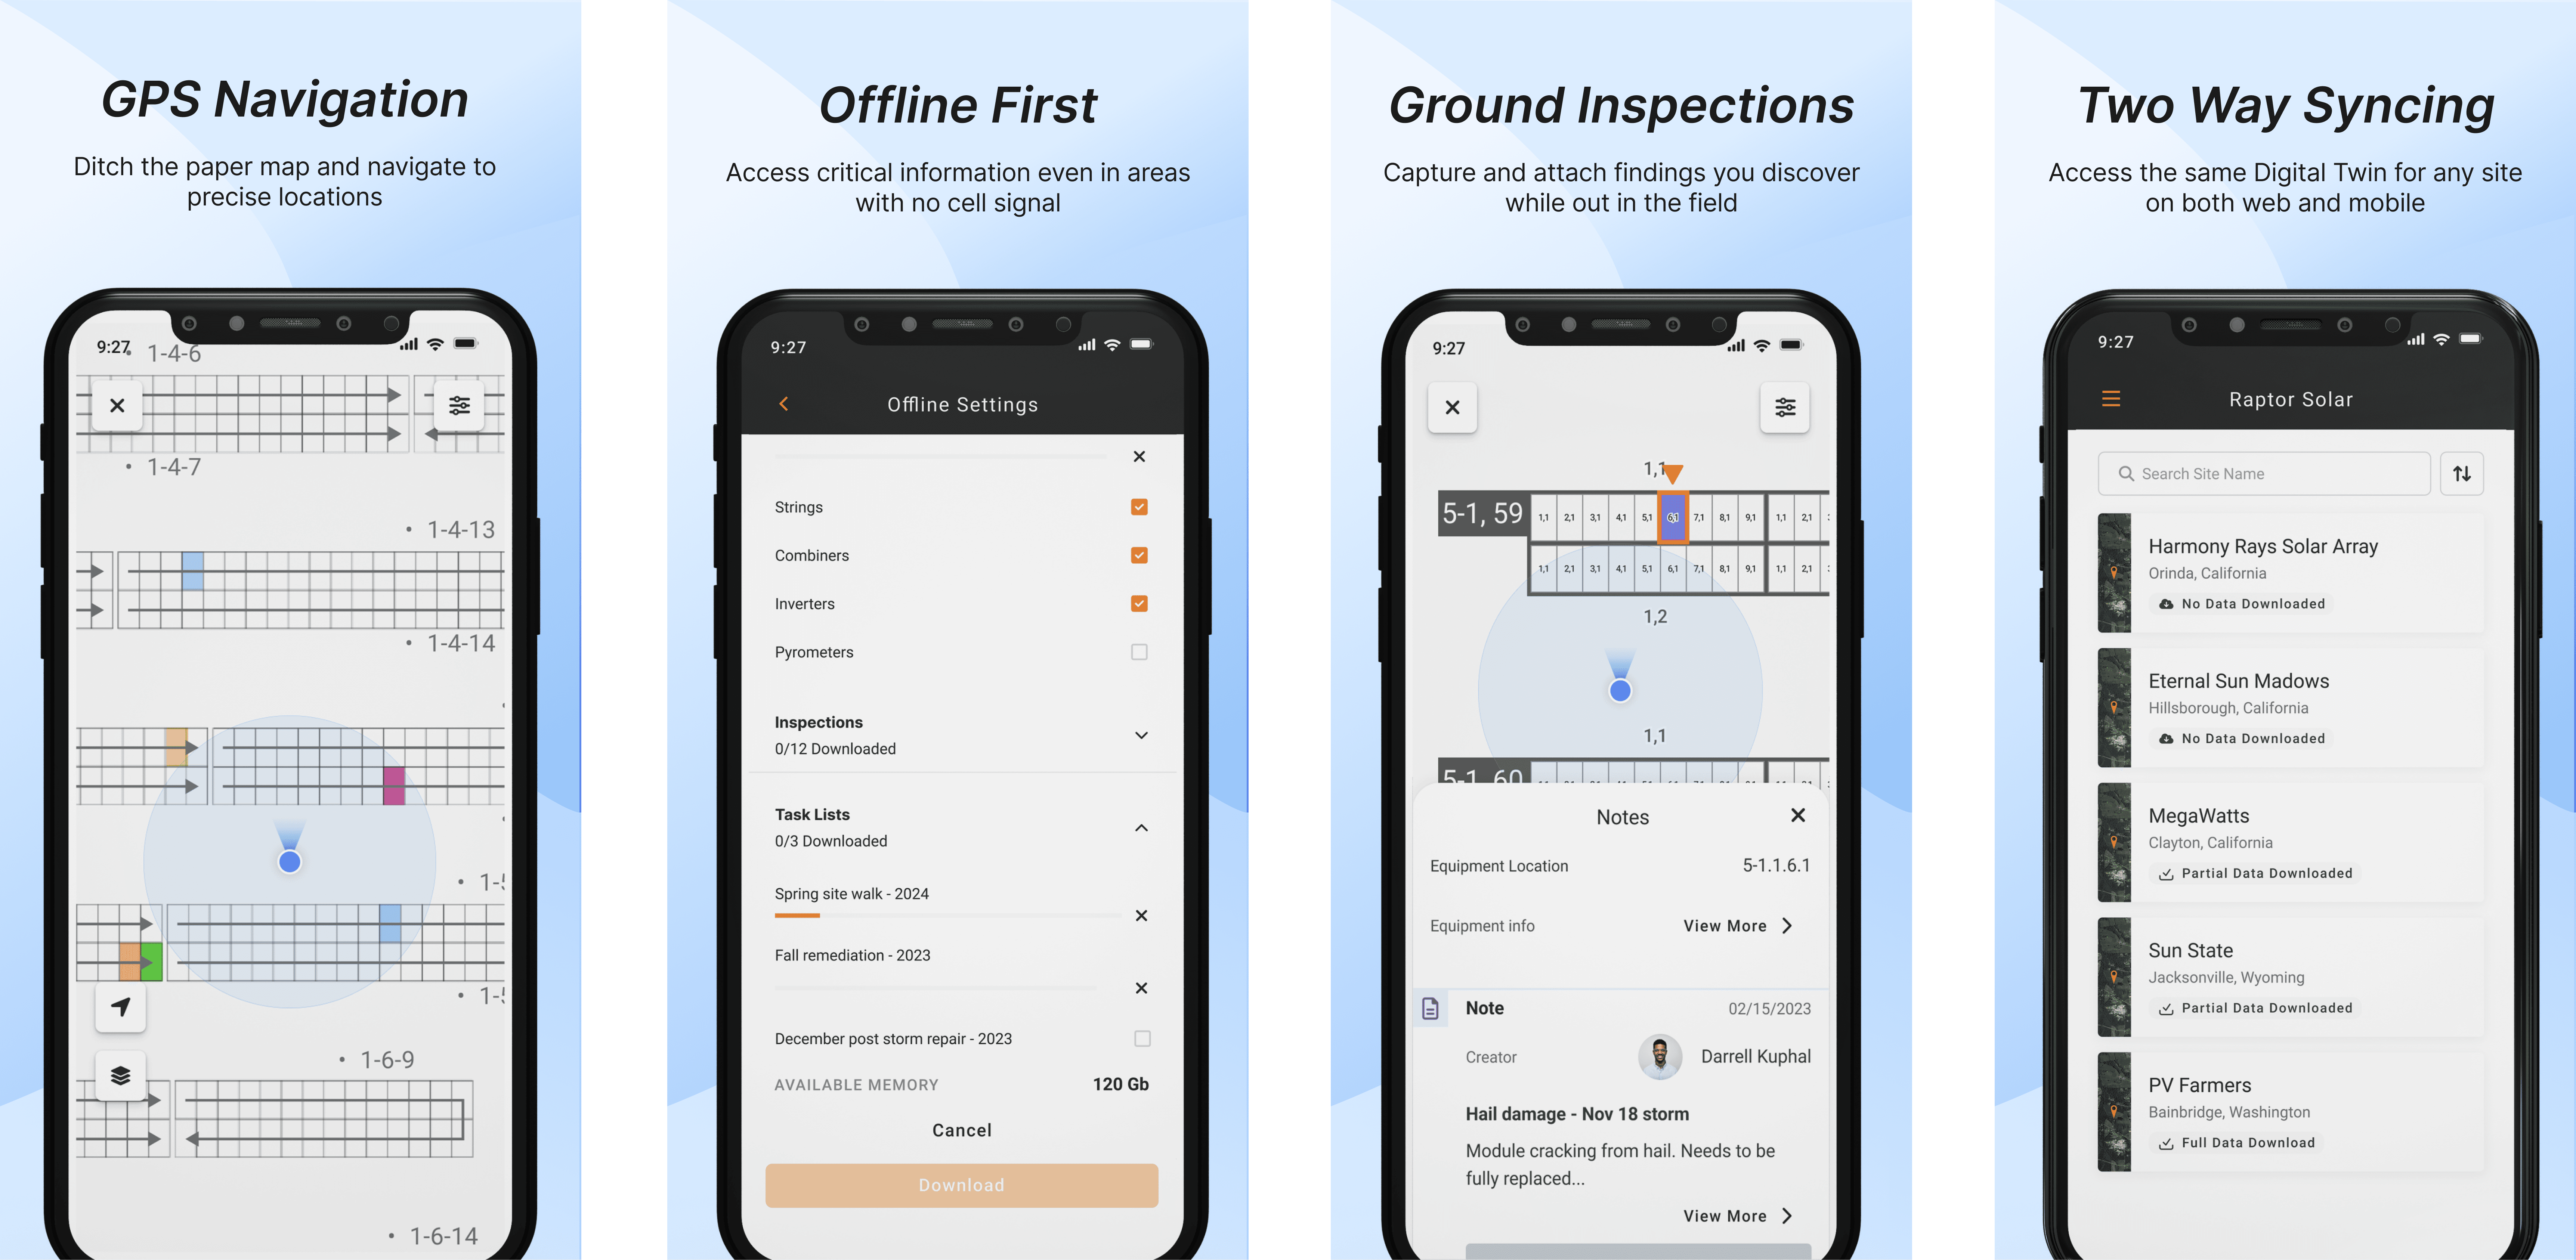
From Day 1, we built our mobile app to make it easier for users in the field to navigate on-site and retrieve the information they need to perform remediation task. That’s why we are so excited to share the next iteration of our mobile app, which significantly improves both the user experience in navigating the site and the performance of the application.
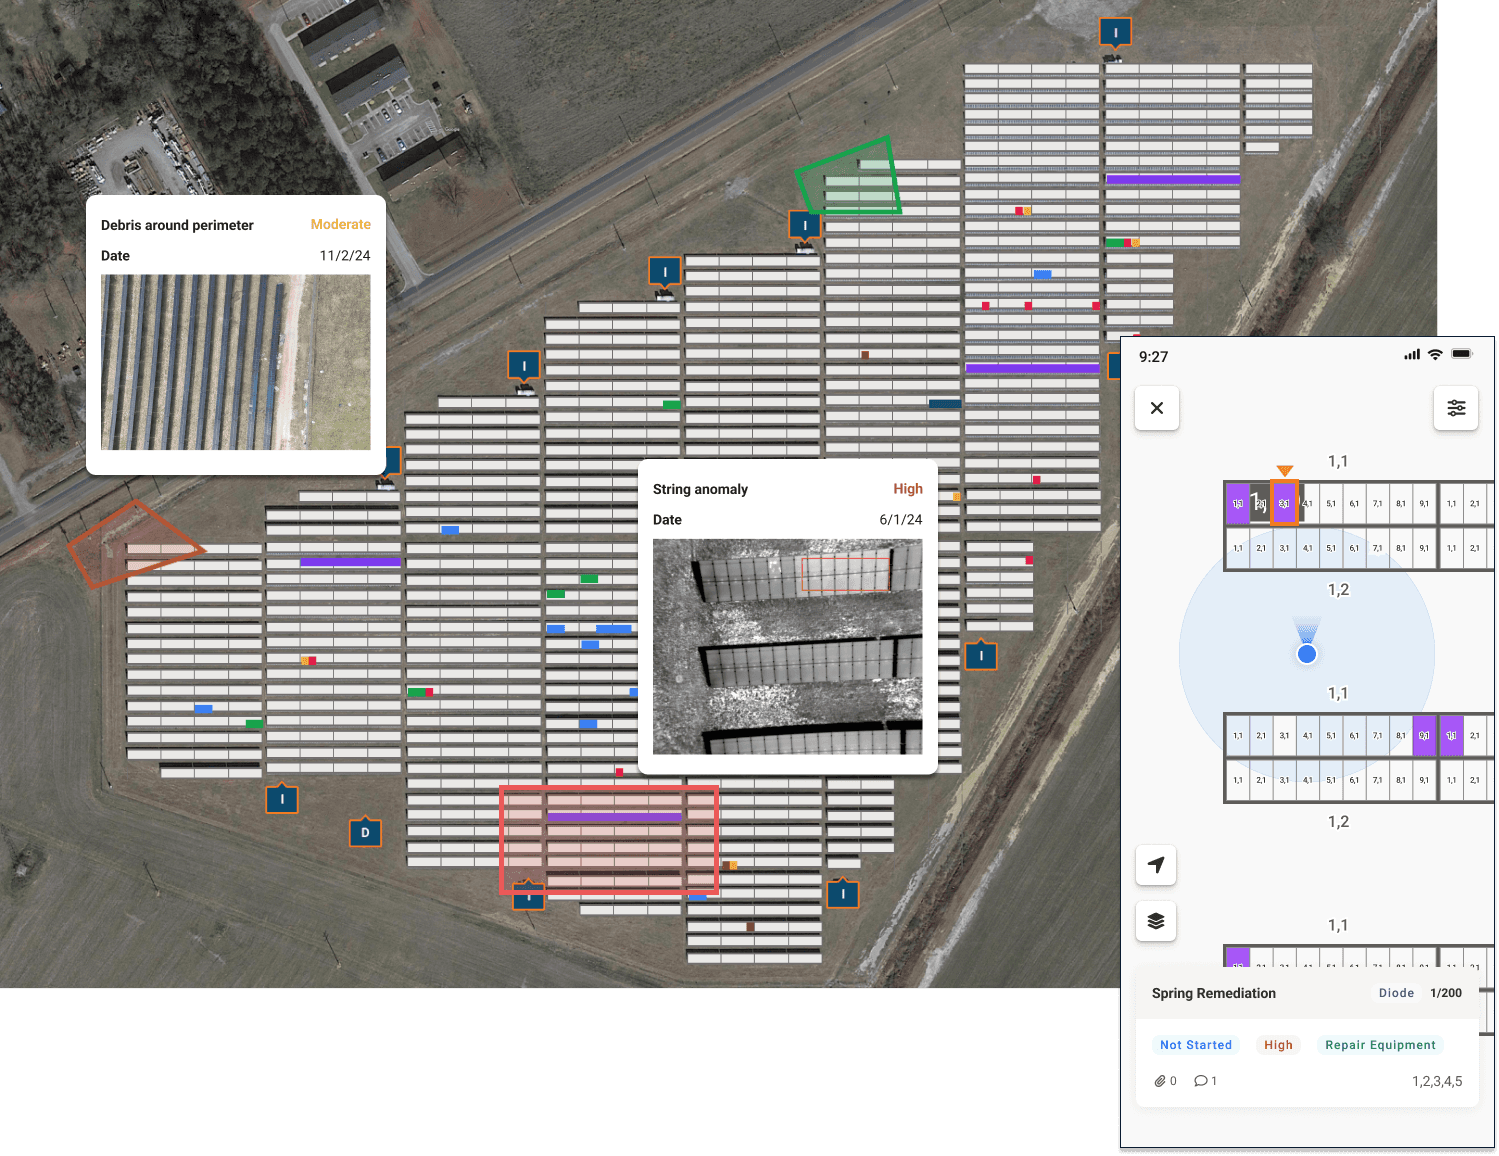
Our new Mobile Map experience visually clusters anomalies, notes, and tasks, making it even easier for field technicians, plant managers, and other users to understand where the hot spots of underperformance lie on-site.
And as you zoom into specific locations on your site, you can see granular equipment and anomaly mapping, from which you can select the equipment in question for further detail. Our new equipment details viewer provides a one-stop shop to view equipment information (such as product information and serial numbers), the full history of identified anomalies, field notes, imagery, and more.
Our customers rely on our mobile app to make remediation more efficient and safer, and we are proud to continue delivering improvements to empower field technicians to do the best work they can in keeping solar energy assets operational and running as expected.
An Improved Raptor Solar Interface
In our latest Raptor Solar update, we've made some changes with ease of use in mind. Our new homepage is now the Portfolio Dashboard view if you have the dashboard feature enabled. Otherwise, it’s the Solar Sites list.
We have also revamped the overview of each of your solar sites, including a new navigation structure, two new pages (“Site Dashboard” and “Inspections”), and a revamped “Site Info” page with editable details.
We are excited to have rolled out more features beyond what we covered in this article today. In particular, look out for ongoing upgrades to navigation across the platform. If you are interested in learning more about these new features or how using Raptor Maps can enhance the health and performance of your solar PV portfolio, please reach out: raptormaps.com/contact-us
Next steps
From the civil engineering on your site down to the wiring on the back of your panels, the Raptor Solar platform provides you detailed, up-to-date data on the conditions and performance of your solar fleet so that your team has the intel they need to do their jobs effectively, quickly, and safely.

