This month, we’ve shipped a handful of feature updates that are enriching the data that we bring to our users, and making the platform easier to navigate. Read on to learn more about a few select releases: Temperature Delta Analysis Tools; enhancements to our Digital Twin, and the new Livestream Dashboard.
Go deeper on thermographic data with the new Temperature Delta Analysis Tool
Users are now able to look at an image of an anomaly within their Digital Twin, draw a polygon around a thermal anomaly, and compare the minimum, maximum, and average temperature of that polygon to a similar component. For example if a thermography inspection detects that there is a high thermal signature on one phase of a substation component, a user can quickly understand the urgency of the hotspot by comparing its temperature to other non-affected phases.
Results from inspections will flag the thermal anomaly for users already, while the Temperature Delta Analysis Tool enables customers to easily and rapidly go deeper into the captured thermal imagery data to understand the severity of the issue.
Check out a related case study: How routine substation inspections prevented a $450K shutdown

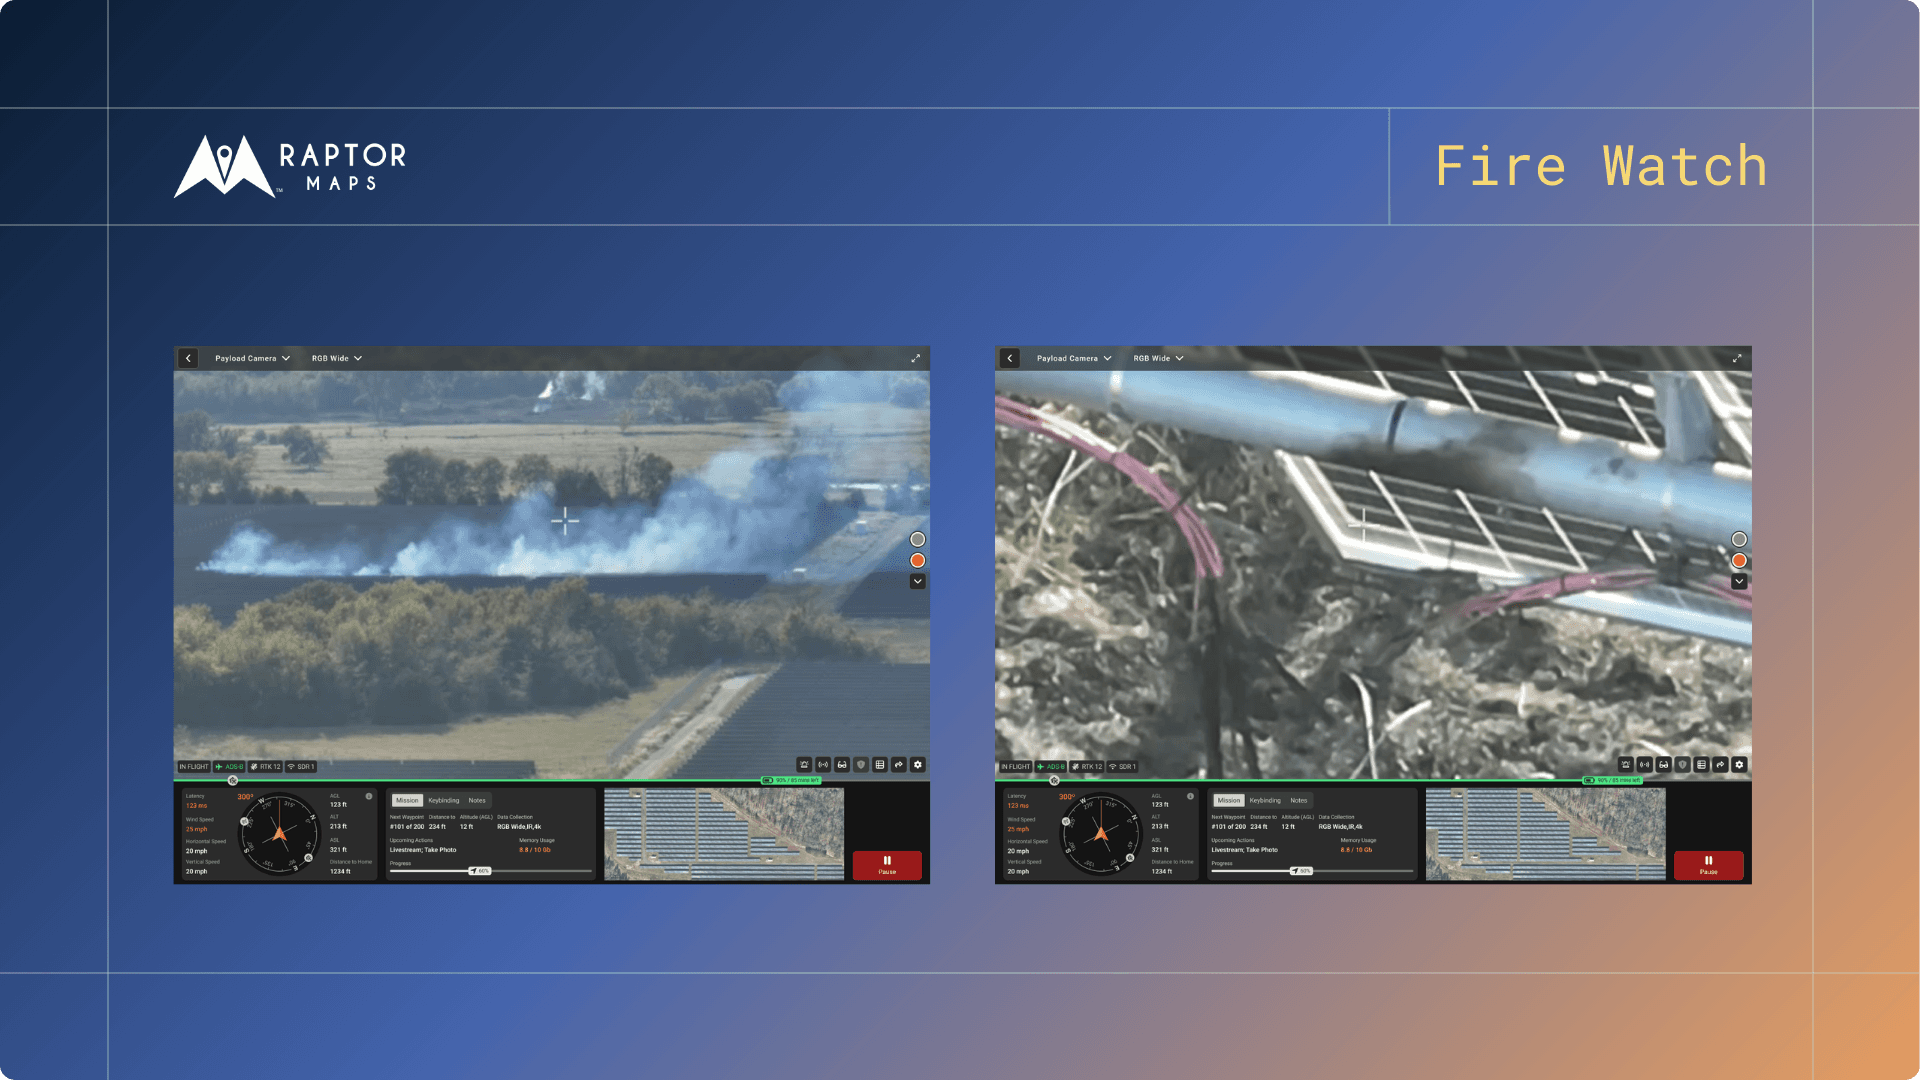
Access up-to-the-minute site intelligence with new Livestream Dashboard
Raptor Solar Sentry users also now have access to a new dashboard in which they are able to view multiple livestreams from active Sentry units all in one place. In this dashboard, users can click into any inspection that is being flown as part of a ‘livestream,’ and rapidly assess site conditions, even if they are offsite.
This new feature allows teams to constantly monitor physical site conditions. For example, if you are made aware of potentially dangerous conditions around an inverter or a substation after a storm, site teams can fly a livestream to assess the physical environment before dispatching your team into a potentially hazardous area.

Digital Twin Export and Navigation Updates
Users are also now able to quickly download and export PDFs of their Digital Twin map with all anomalies and equipment tagged to an individual circuit block. PDF downloads can be of the full site map, or zoomed in on a particular area of interest. This feature enables site teams to easily navigate to anomalies while offline, and work from a shared source of truth relating to site health. This export feature enables asset managers to share data with sub-contractors and seek bids for operations and maintenance services.
Furthermore, the Digital Twin now includes circuit block labels that persist as users zoom in and out of the Digital Twin map, allowing users to easily access critical site context as they use the platform.
Give these new features a try by logging in with your Raptor Solar account here.

Next steps
From the civil engineering on your site down to the wiring on the back of your panels, the Raptor Solar platform provides you detailed, up-to-date data on the conditions and performance of your solar fleet so that your team has the intel they need to do their jobs effectively, quickly, and safely.