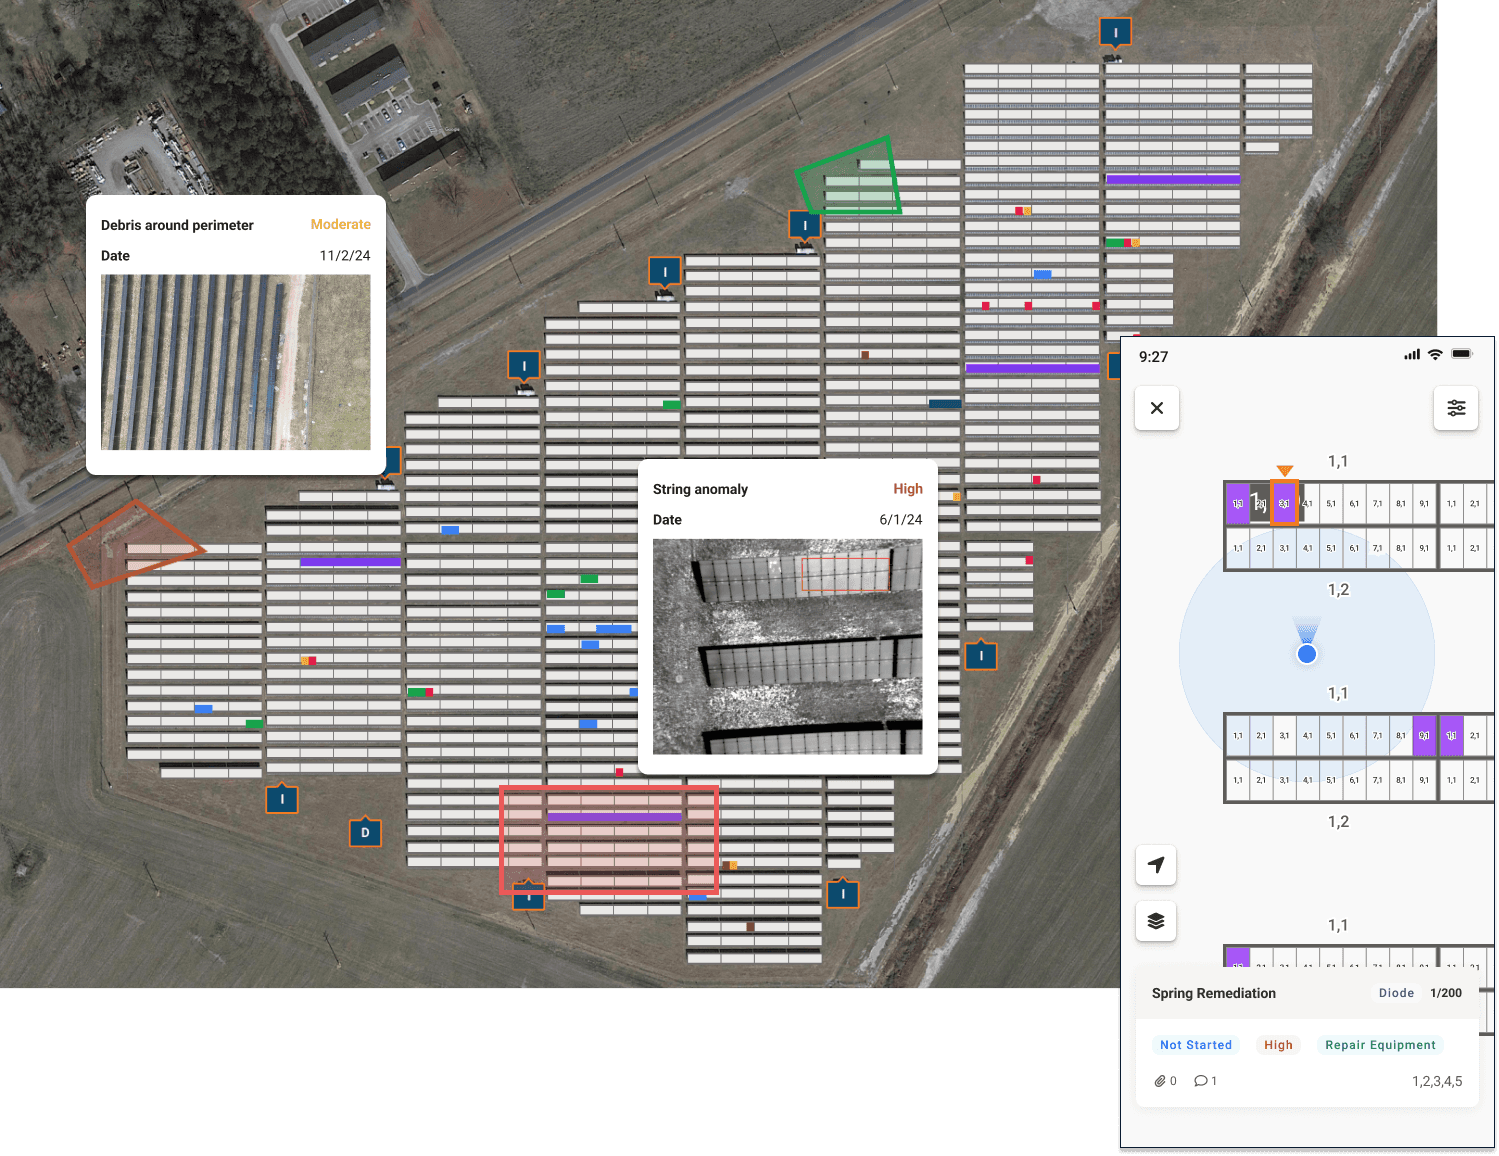
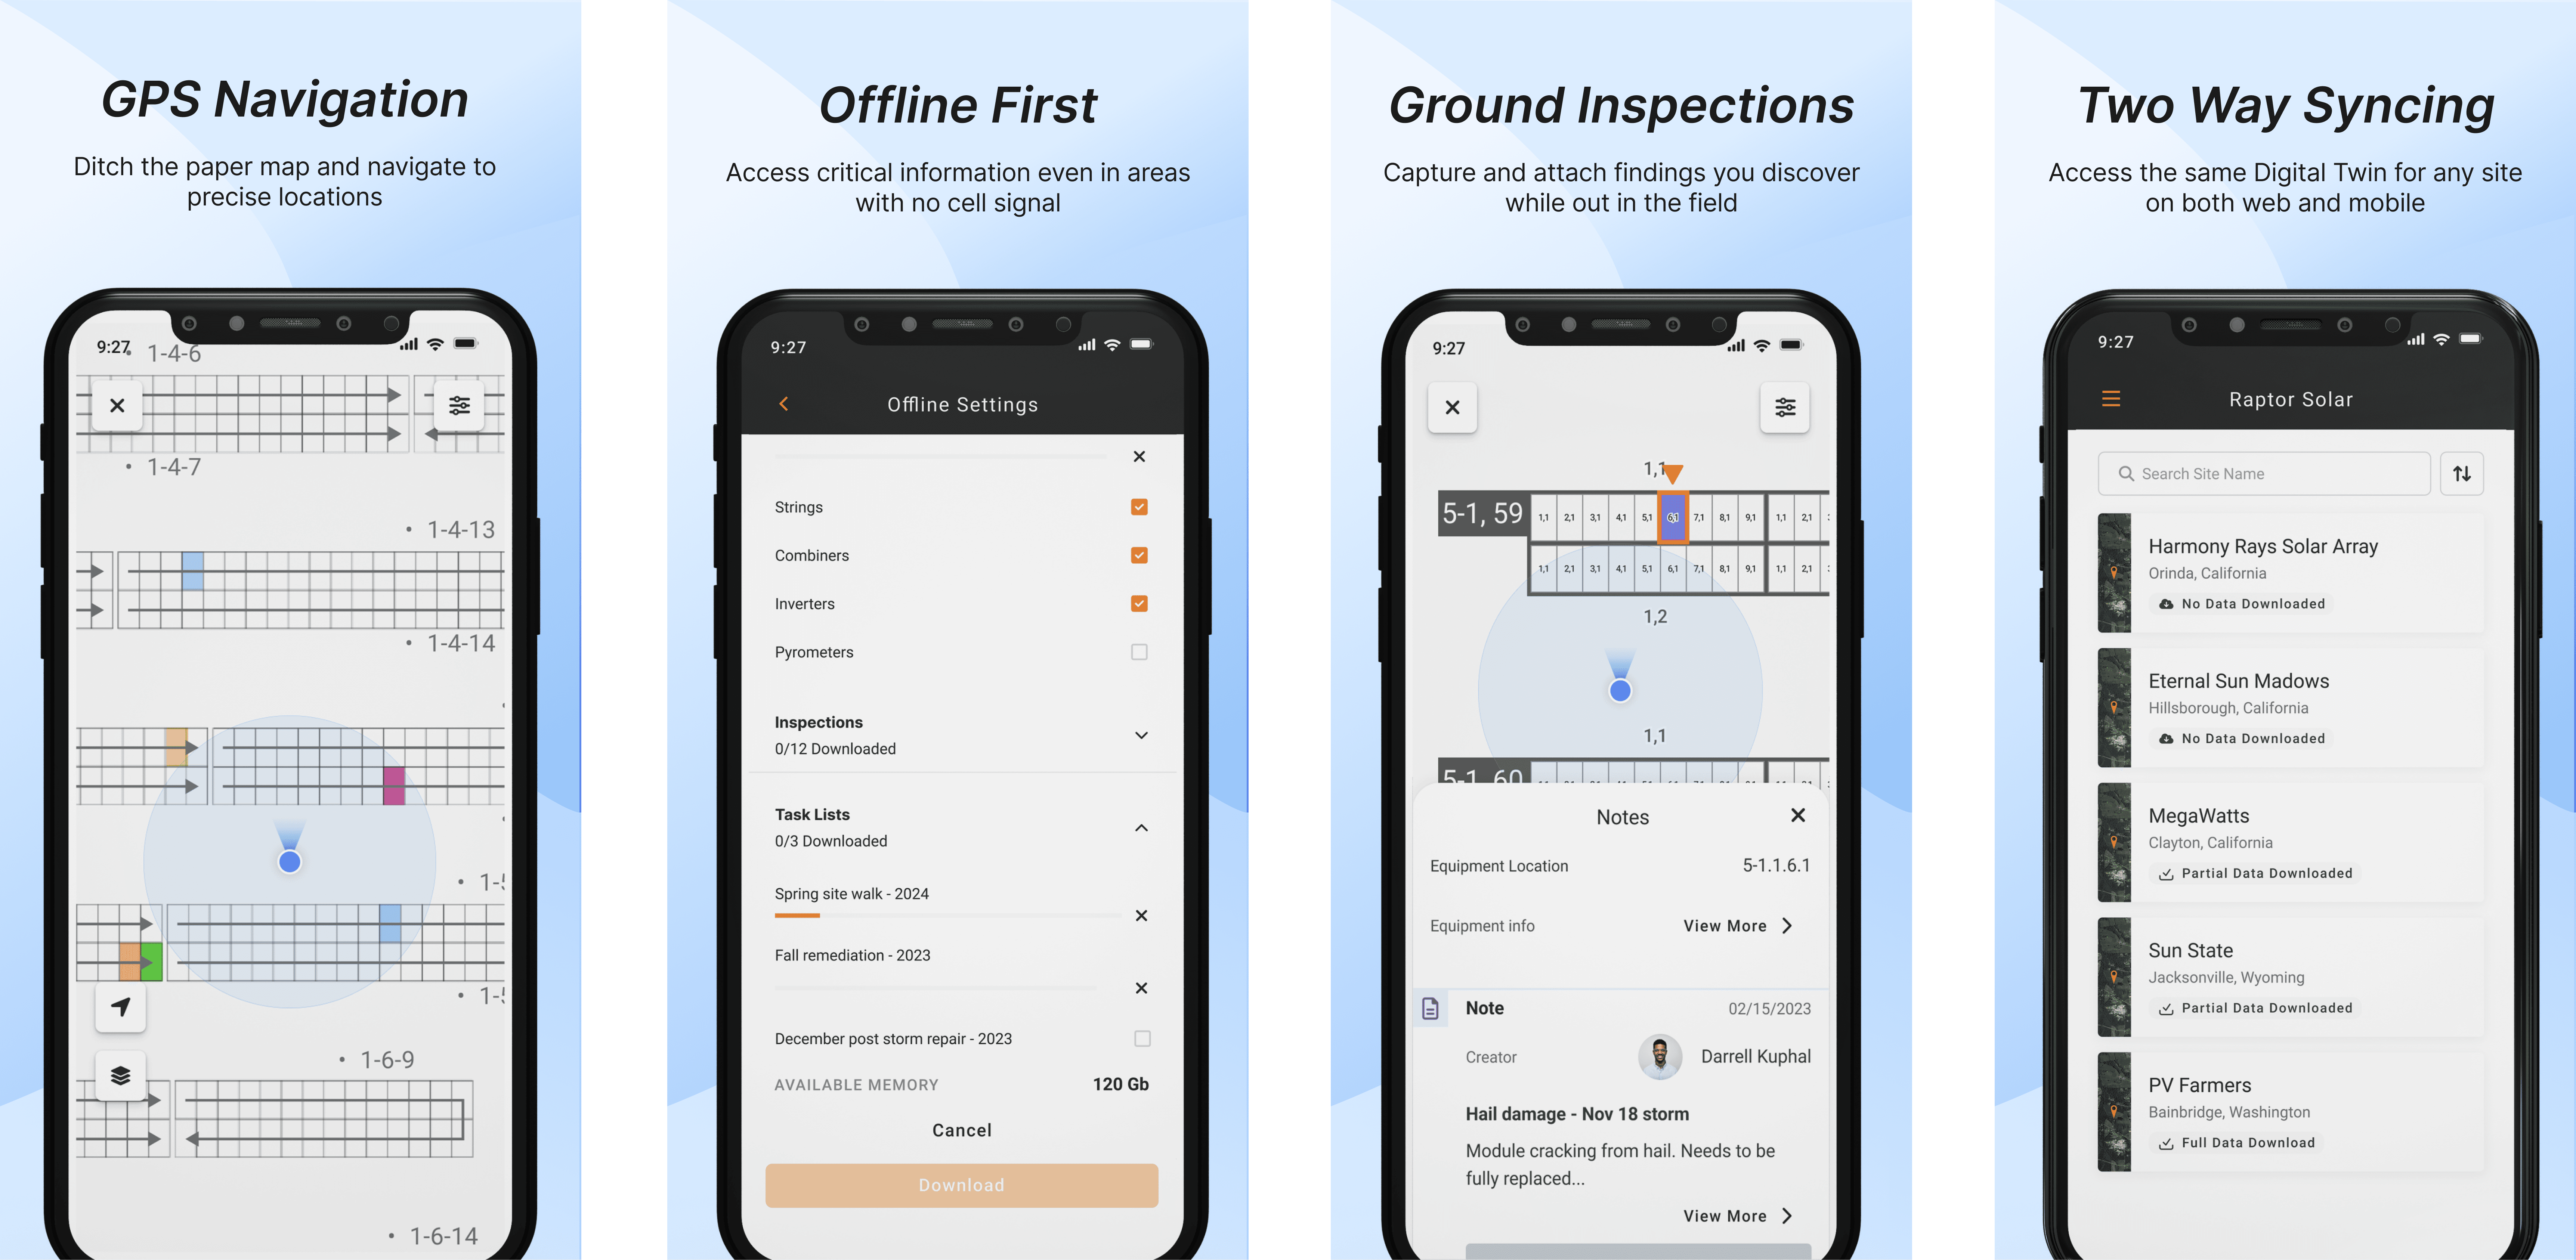
Legacy processes are everywhere in solar, and here at Raptor Maps we’re committed to moving them forward so the industry can scale.
Our recent product iterations have focused on digitizing some of the more painful outdated systems that are in place — like, say, having to review policies, track different email threads, and manage Excel files just to submit a warranty claim.
With digitization, solar stakeholders can maximize performance, reduce costs, and standardize operations. Digitization also extends to improving efficiency in the field.
We are committed to connecting players across the ecosystem with the click of a button and to keeping customers informed about every aspect of an asset via the digital twin.
A tech-forward claims process
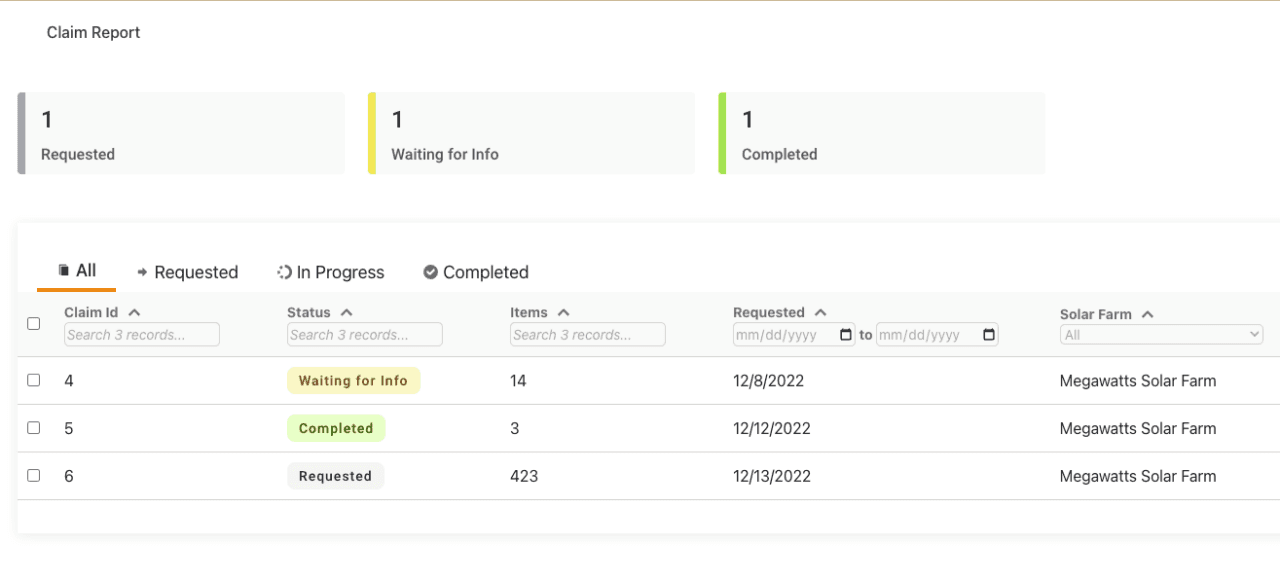
Our enterprise-grade warranty claims product — released in partnership with Jinko Solar, one of the largest PV module manufacturers — saves time for owners and operators.
Communication about a claim takes place within the Raptor Solar platform, with owners and operators submitting directly, and manufacturers finalizing and approving claims within the software.
The product streamlines what has historically been a cumbersome administrative process.
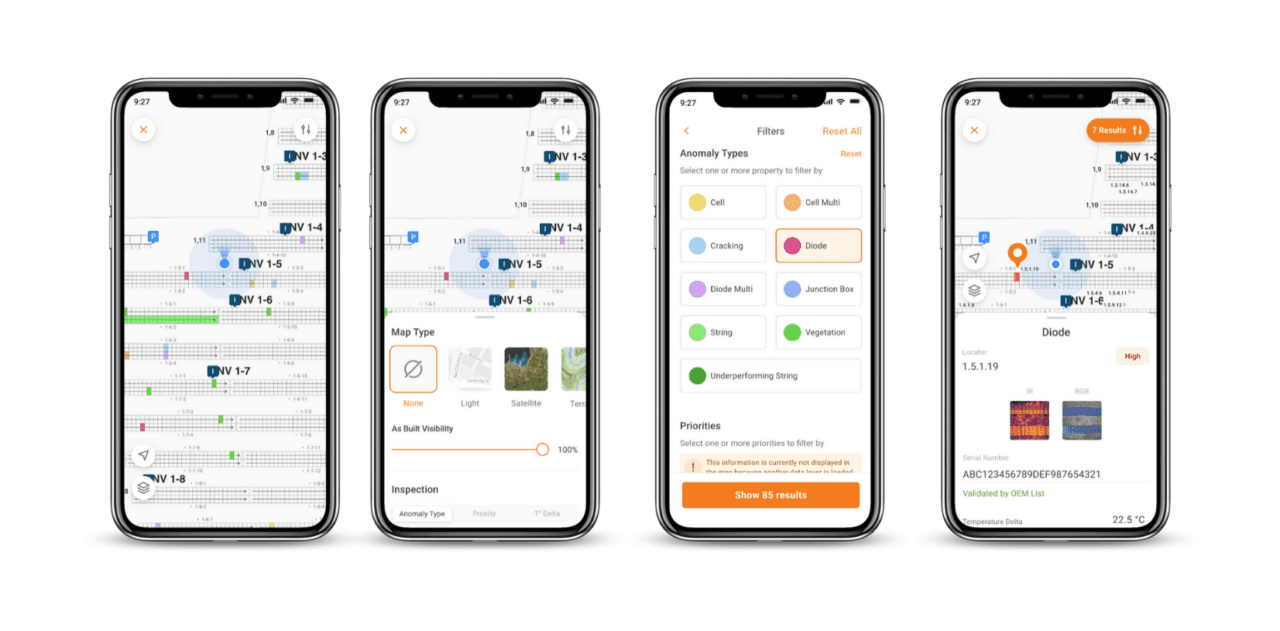
Field technicians, this new map experience is for you
We’ve evolved our map features with a goal of supporting action in the field – from preventative maintenance to corrective maintenance, our mobile app can help.Users of our Raptor Maps mobile app can now view all anomalies from any inspection within a single map view. Choose from a variety of map layers, and set the as-built transparency to your liking. Then filter by the anomaly types or priority you are looking for. Lastly, use your own location to move between the results in any order you choose.We didn’t stop there: We also boosted our web experience for browsing solar sites. Site coordinators and managers will appreciate the new mini-map, which shows you where you are within the site’s boundaries at all times. Also, we added the geo-location feature to the web so that both mobile and web views have the same feature.Watch this space: There’s lots more planned for next year on the mobile front.
SCADA data integrated into inspection analytics
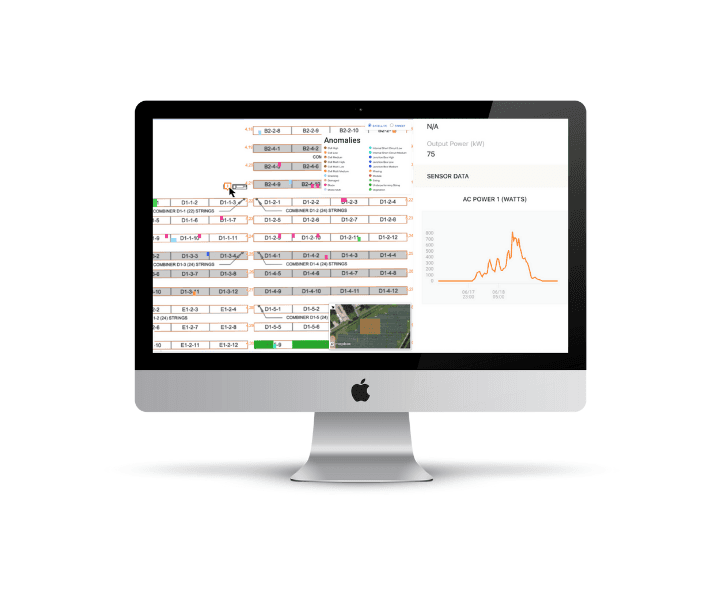
With Raptor Maps’ SCADA and DAS integrations, solar companies can localize time series data within a digital twin. We recently integrated with GreenPowerMonitor to localize inverter, combiner, and pyranometer data to the correct geospatial position on a solar farm. The integration works in tandem with thermography analytics for immediate assessments of how underperforming conditions impact power production.
Customers can also leverage integrations with leading providers such as AlsoEnergy, Power Factors, and several others. This integrated dataset supports real-time comprehensive financial analysis as well as more efficient field operations. A sophisticated degradation analysis is now made easier through the use of normalized temperature deltas, which can strengthen warranty claims.
As we continue to add important sources of structured data to the digital twin, we are able to provide deeper insights for you at site-, fleet- and market-levels.
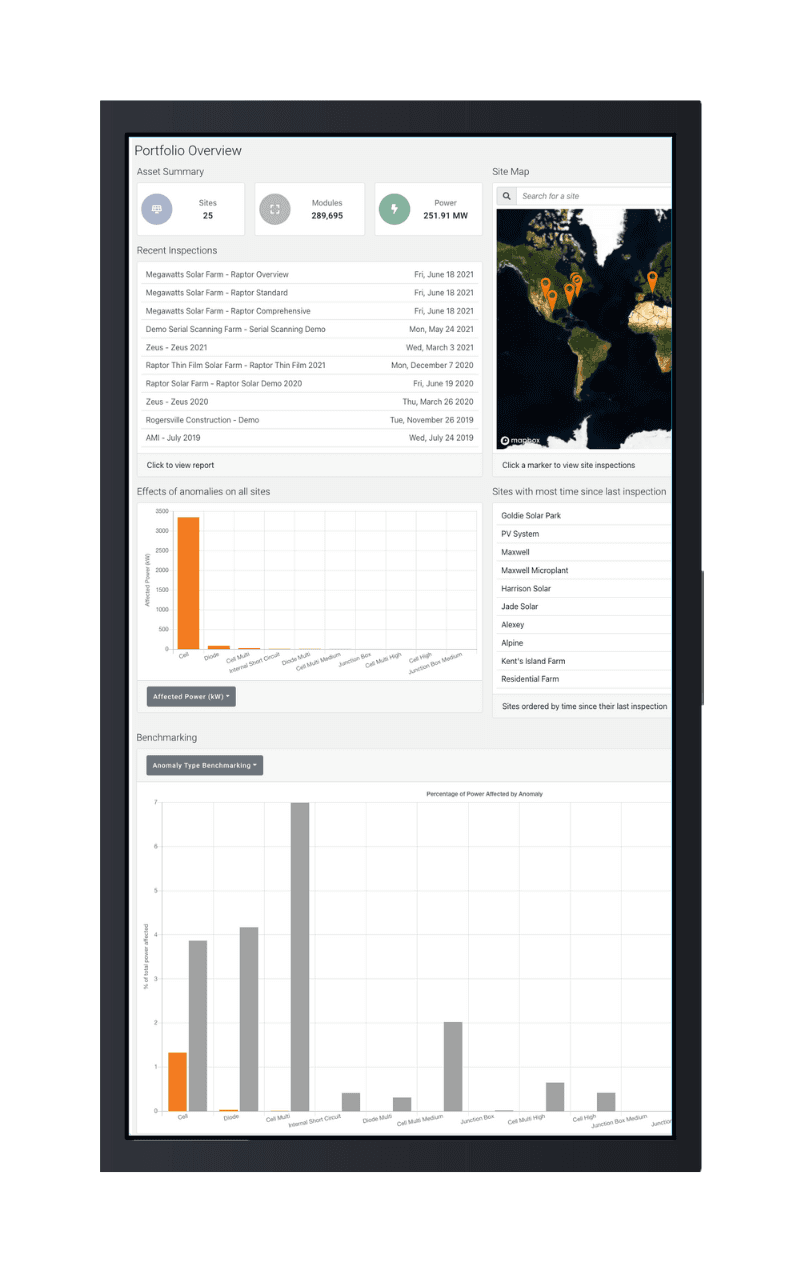
A dashboard with comprehensive insights
Raptor Maps’ digital twin incorporates geospatial and electrical relationships to create a standardized data model across an entire portfolio, and our dashboard allows users to easily access that benchmarking data.
What’s a digital twin? A virtual copy of your physical asset. A digital twin ingests and structures data from any number of sources so that you have one dynamic system of record. One of the many benefits of a digital twin, is identifying and predicting possible performance outcomes.
Users can click on a module in a fully populated digital twin to analyze key analytics, including factory performance data, supply chain details, installation verification, inverter metrics, repair or replacement information, and the financial implications of O&M decisions.
Finally, in case you missed it…
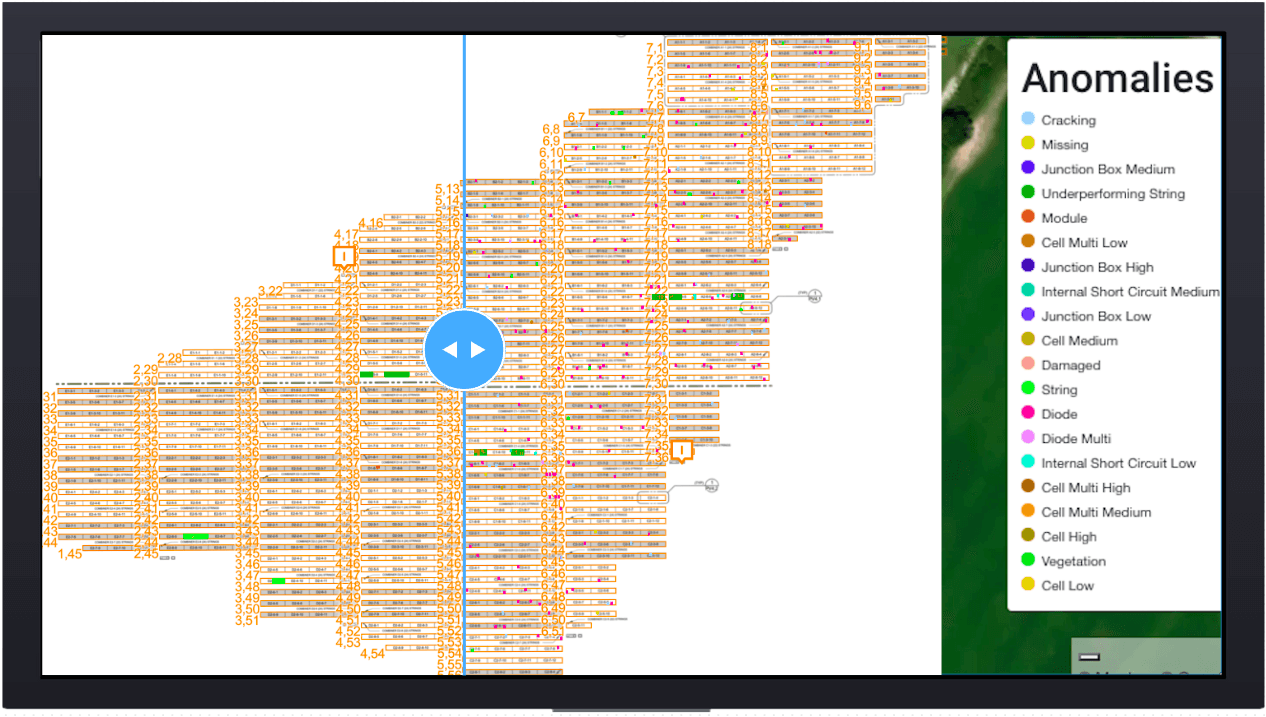
Not sure if an anomaly is new or chronic? You can compare inspection data across past reports for any site using our Report Comparison feature, which helps you manage your watchlists effectively. Track anomalies year over year in a centralized platform to confirm new and existing anomalies are being addressed.
Inspection reports from different vendors over the years? Not a problem. Our digitization process is vendor agnostic, and can ingest inspection data regardless of the data collection method (drone or plane).
Are there other improvements you’d like to see from Raptor Maps’ products? If so, we want to hear from you. Please reach out to us here.
Next steps
From the civil engineering on your site down to the wiring on the back of your panels, the Raptor Solar platform provides you detailed, up-to-date data on the conditions and performance of your solar fleet so that your team has the intel they need to do their jobs effectively, quickly, and safely.


