Solutions

How you benefit

Resources

About

Solutions

How you benefit

Resources

About

/

Raptor App

/

Calculating Inspection Temperature Deltas

Calculating Inspection Temperature Deltas

Calculating Inspection Temperature Deltas

Calculating Inspection Temperature Deltas

Calculating Inspection Temperature Deltas

Calculating Inspection Temperature Deltas

Search…

Getting Started

+

Getting Started

+

Getting Started

+

Information To Provide

+

Information To Provide

+

Information To Provide

+

Uploading Data

+

Uploading Data

+

Uploading Data

+

Raptor Mobile App

+

Raptor Mobile App

+

Raptor Mobile App

+

Instant Inspections

+

Instant Inspections

+

Instant Inspections

+

Instant Inspections - Data Notes

+

Instant Inspections - Data Notes

+

Instant Inspections - Data Notes

+

Sharing Reports & Settings

+

Sharing Reports & Settings

+

Sharing Reports & Settings

+

Drone Service Providers & Info

+

Drone Service Providers & Info

+

Drone Service Providers & Info

+

O&M Flight Ops — General

+

O&M Flight Ops — General

+

O&M Flight Ops — General

+

O&M Flight Ops — Drones

+

O&M Flight Ops — Drones

+

O&M Flight Ops — Drones

+

O&M Flight Ops — Manned Aircraft

+

O&M Flight Ops — Manned Aircraft

+

O&M Flight Ops — Manned Aircraft

+

Raptor Maps uses a combination of automated algorithms to estimate the temperature delta (aka Delta T) of various anomalies that are present in thermal imagery of solar equipment. Thermal images (typically radiometric JPEGs or RJPEGs) encode radiometric data that can be converted into temperature measurements.
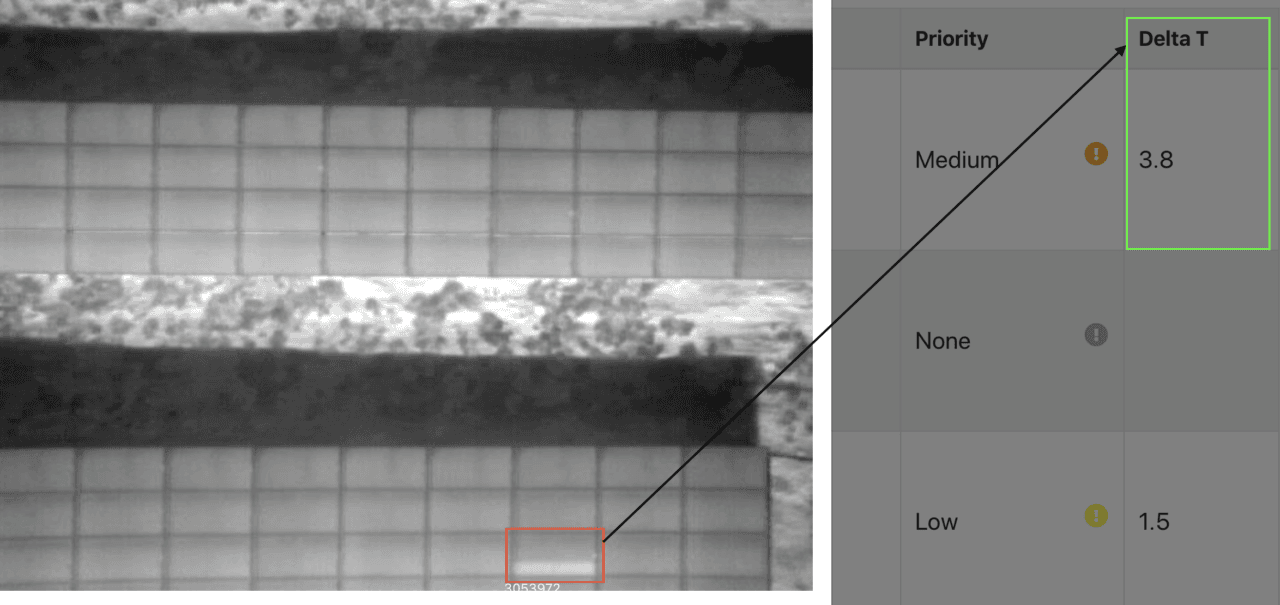
An example of the Delta T of a Diode anomaly. The diode is 3.8 degrees hotter than the rest of the module.

A temperature delta for a solar anomaly is typically defined as the difference in temperature between an anomalous component and a non-anomalous component or area (i.e., nominal).

To conservatively estimate temperature deltas, the algorithms choose the maximum pixel temperature recorded in an anomaly and compare it to the average of the pixel temperatures of neighboring components.

For example, the temperature delta of a single-cell anomaly would be the hottest pixel temperature recorded at the anomalous cell minus the average temperature of nearby cells with a nominal temperature. The temperature delta of a multi-cell anomaly on a single module would be the maximum temperature recorded of all anomalous cells minus the average temperature of nearby cells with nominal temperature.

Depending on data quality, the algorithms also have the complexity to choose pixels of nominal components of surrounding modules. This is particularly useful for anomalies like severe cracking, where the algorithm could choose the hottest point in the crack and compare it to a non-cracked module nearby. It is also useful when it is difficult to assess what is precisely nominal or anomalous in a single module. 

Temperature deltas can be a function of the current irradiance. Temperature deltas can be further normalized by associating thermal imagery and anomalies to the irradiance measurements from plane-of-array (POA) pyranometers. This is to take into consideration that a temperature delta measured at a lower irradiance could manifest as a higher temperature delta at a higher irradiance value or vice versa.

The specific software algorithms used to calculate temperature deltas are proprietary to Raptor Maps and were engineered to make estimates similar to measuring a radiometric image by hand with points and polygon pixel-selection tools at gigawatt scale. The algorithms do assume that the input data are of good quality.

© 2023 Raptor Maps, Inc.

444 Somerville Ave.
Somerville, MA 02143

Stay Up to Date

Subscribe to our newsletter and stay informed about innovations in solar asset optimization, deploying robotics for solar, our research and testing with OEMs, the latest in our product development, and more.

© 2023 Raptor Maps, Inc.

444 Somerville Ave.
Somerville, MA 02143

Stay Up to Date

Subscribe to our newsletter and stay informed about innovations in solar asset optimization, deploying robotics for solar, our research and testing with OEMs, the latest in our product development, and more.

© 2023 Raptor Maps, Inc.

444 Somerville Ave.
Somerville, MA 02143

Stay Up to Date

Subscribe to our newsletter and stay informed about innovations in solar asset optimization, deploying robotics for solar, our research and testing with OEMs, the latest in our product development, and more.

© 2023 Raptor Maps, Inc.

444 Somerville Ave.
Somerville, MA 02143

Stay Up to Date

Subscribe to our newsletter and stay informed about innovations in solar asset optimization, deploying robotics for solar, our research and testing with OEMs, the latest in our product development, and more.

© 2023 Raptor Maps, Inc.

444 Somerville Ave.
Somerville, MA 02143

Stay Up to Date

Subscribe to our newsletter and stay informed about innovations in solar asset optimization, deploying robotics for solar, our research and testing with OEMs, the latest in our product development, and more.

This website uses cookies

This website stores cookies on your computer to track usage across media in accordance with our Privacy Policy.

Decline

Accept

This website uses cookies

This website stores cookies on your computer to track usage across media in accordance with our Privacy Policy.

Decline

Accept

This website uses cookies

This website stores cookies on your computer to track usage across media in accordance with our Privacy Policy.

Decline

Accept

This website uses cookies

This website stores cookies on your computer to track usage across media in accordance with our Privacy Policy.

Decline

Accept

This website uses cookies

This website stores cookies on your computer to track usage across media in accordance with our Privacy Policy.

Decline

Accept