Raptor Maps creates a Digital Twin for each of your solar assets. Navigate to the digital twin to interact with inspection findings, review detected vs. resolved anomalies, and much more.
Navigate to app.raptormaps.com and log in using your credentials. If you do not have a Raptor Maps account, please ask your organization’s admin to add you following this guide
Select a site from the Dashboard or navigate to your complete Solar Sites list
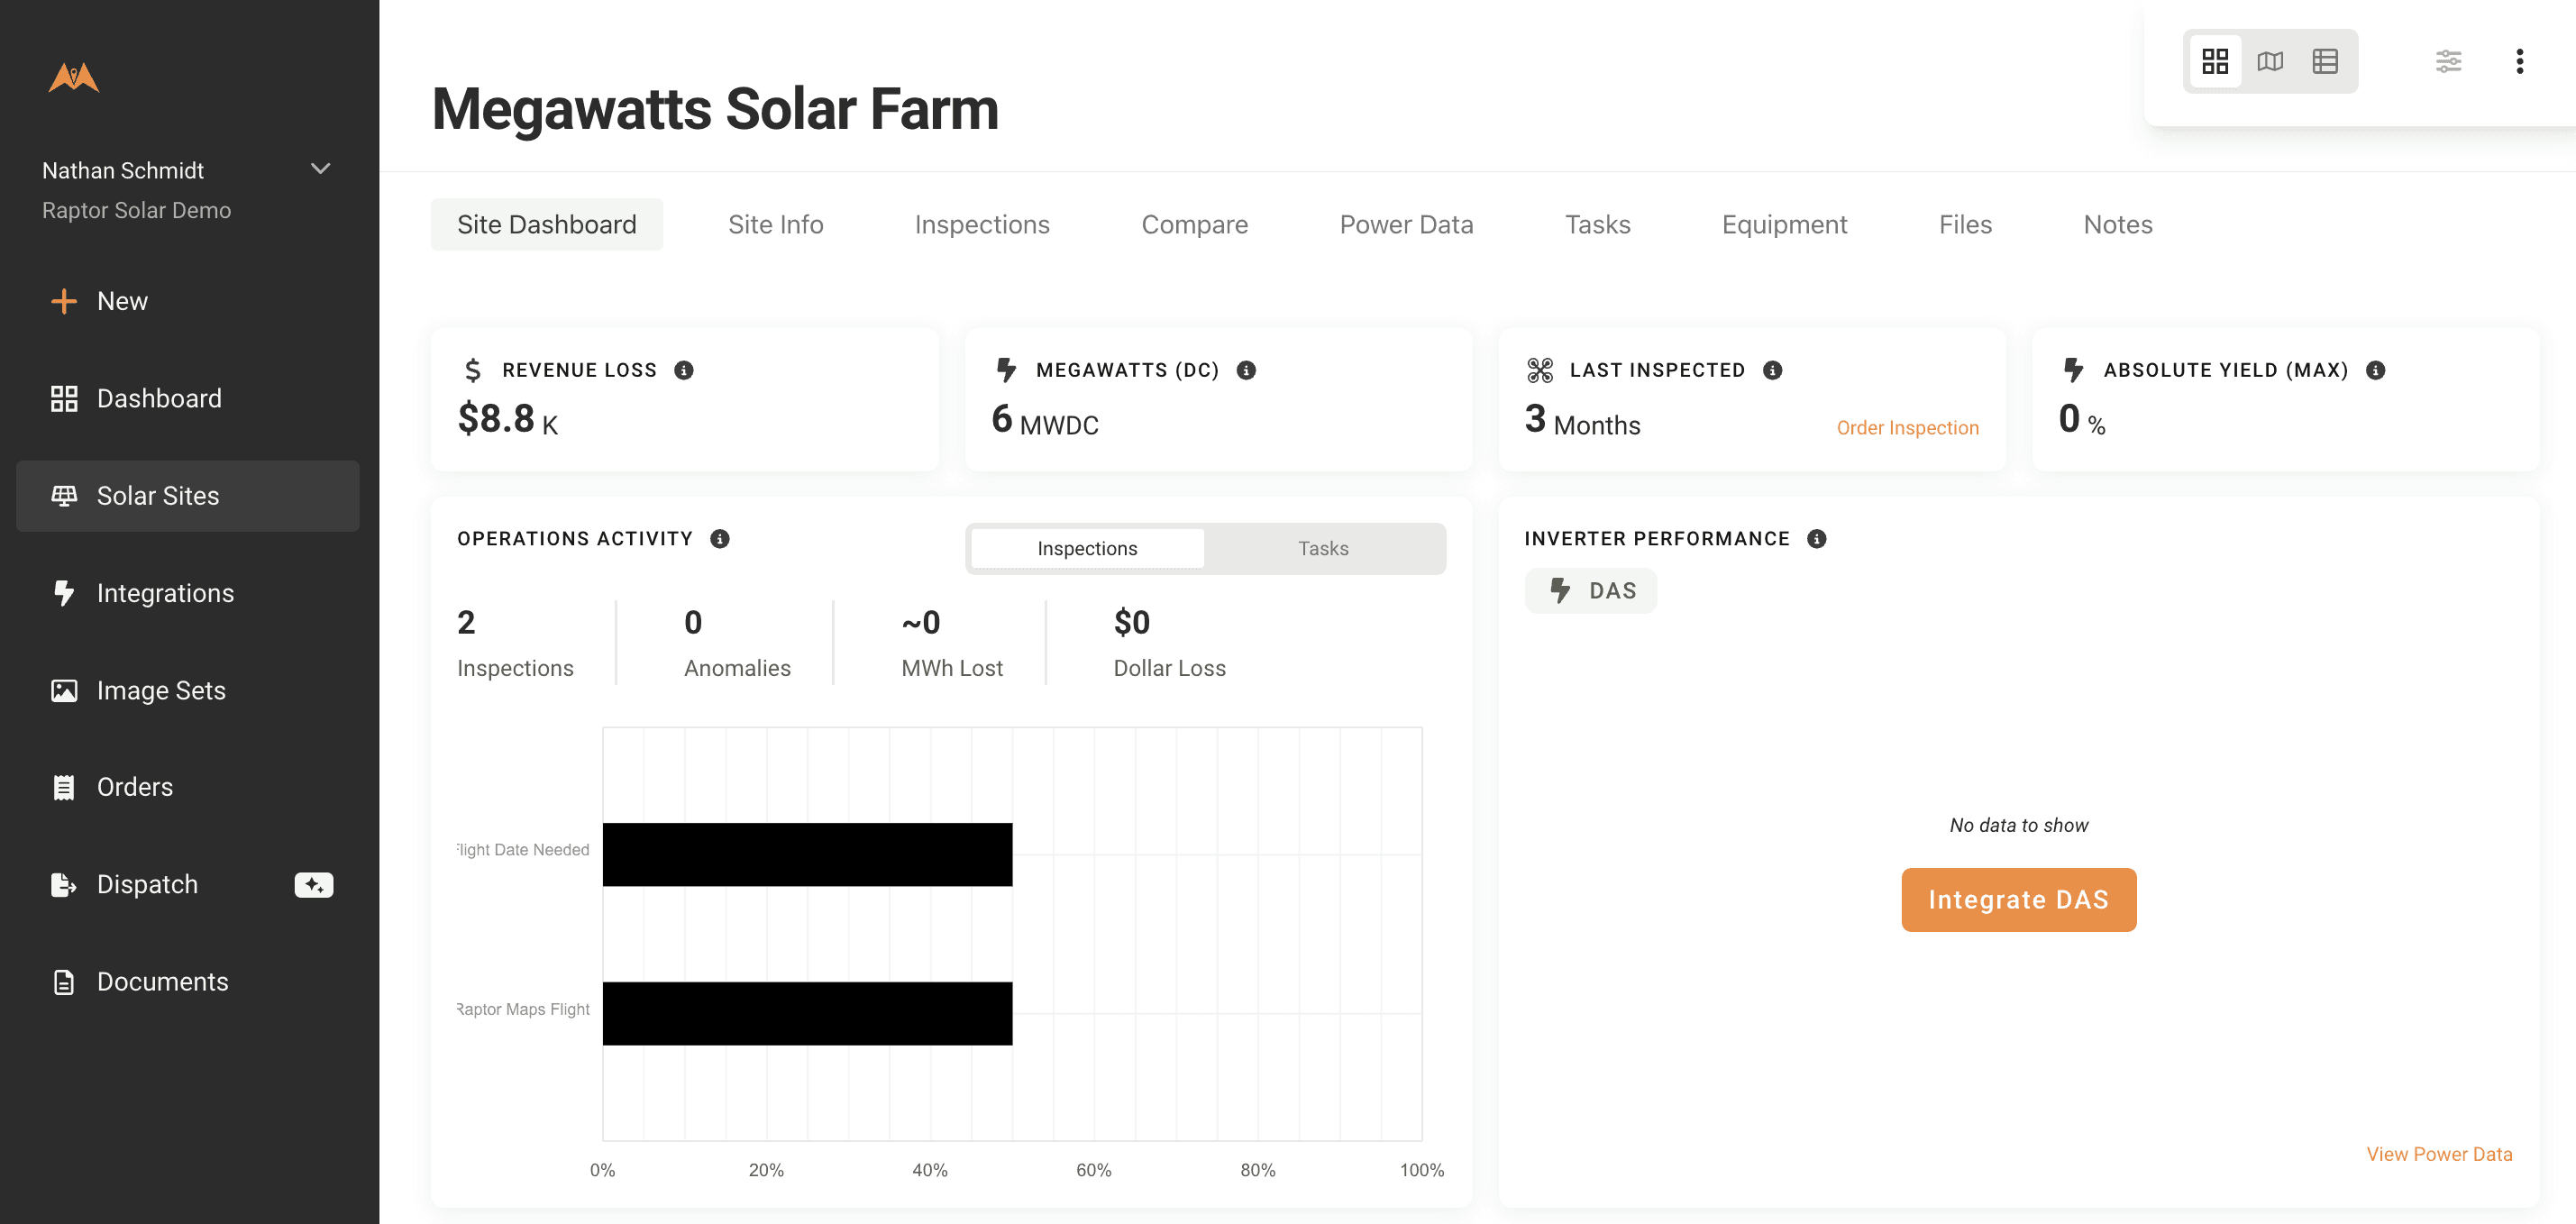
Site Overview with site-level tools:

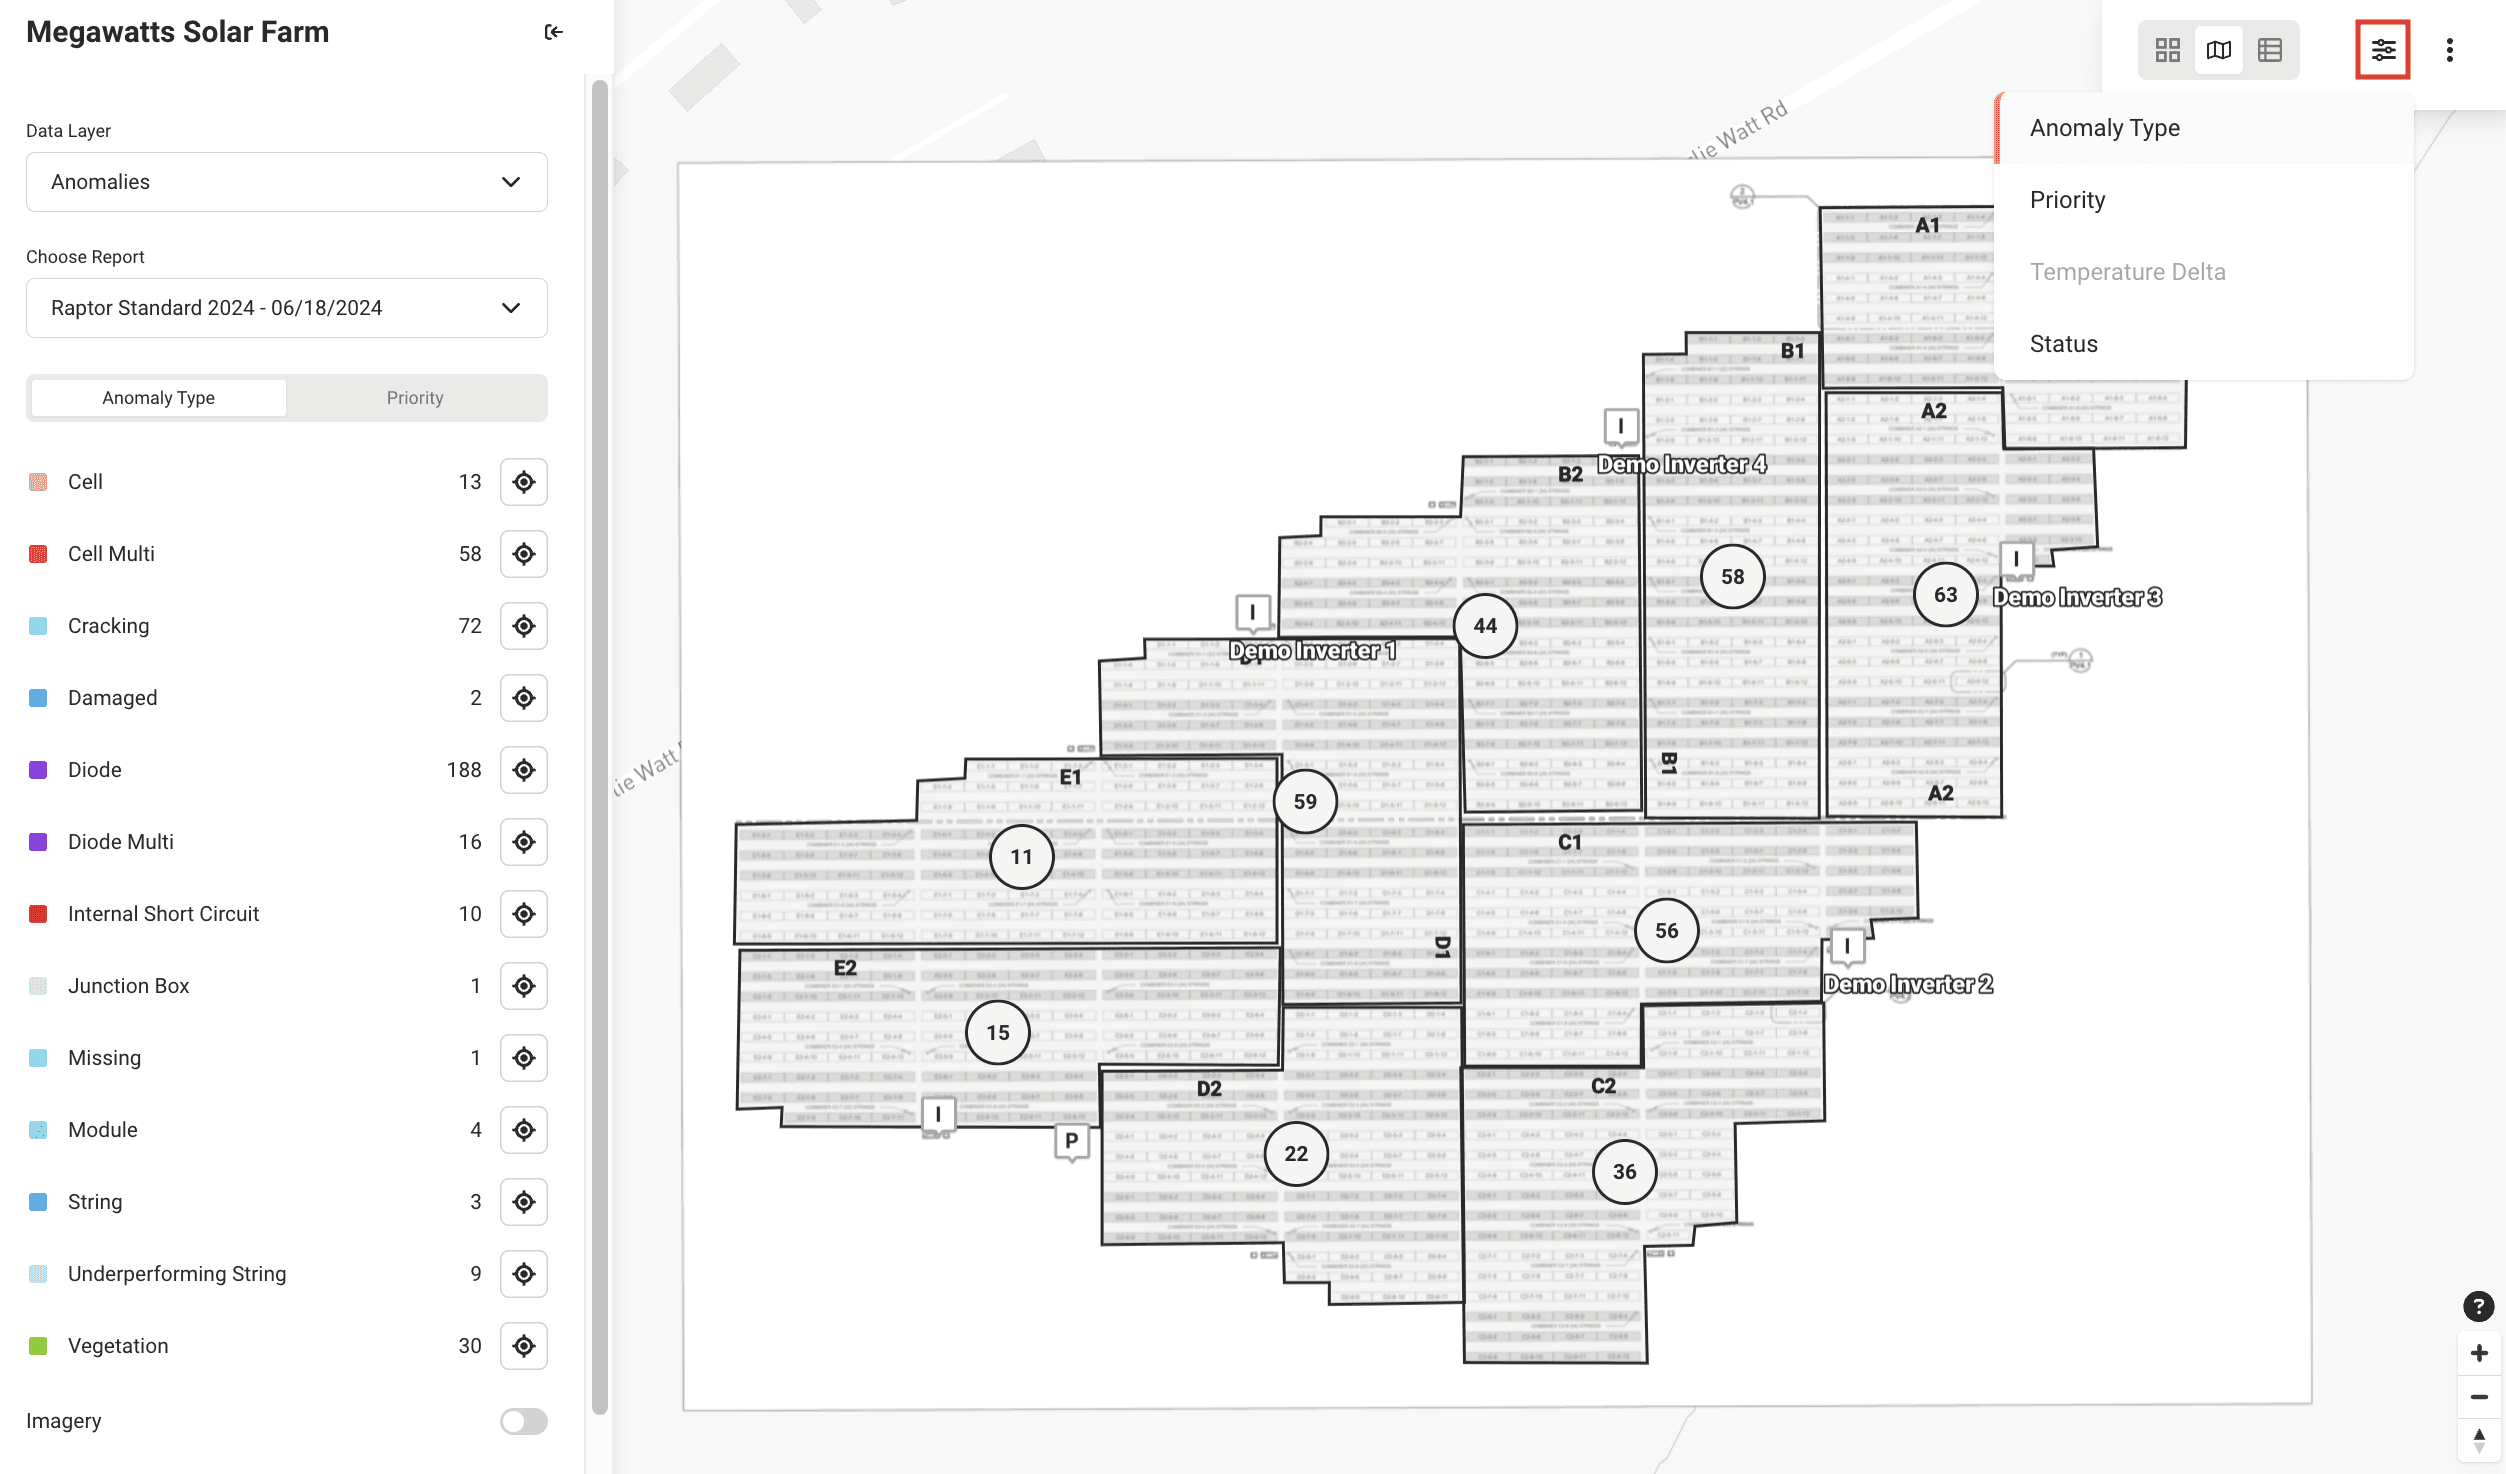
Map View:
Select an Inspection or navigate to the Digital Twin via the menu in the upper-right as shown here:
Once an inspection has been selected, a summary of findings (by anomaly type) will populate in the left toolbar

Each block in the map will display a numbered bubble corresponding to the sum of anomalies in that block. These sums are responsive to the filters you select
Filter between anomaly types/statuses via the “slider” icon in the upper-right (shown below)
Scroll down past the anomalies in the left toolbar to reveal “Background” options to manage the visibility of map layers
Zooming in on an inverter block will reveal the individual anomalies in the map
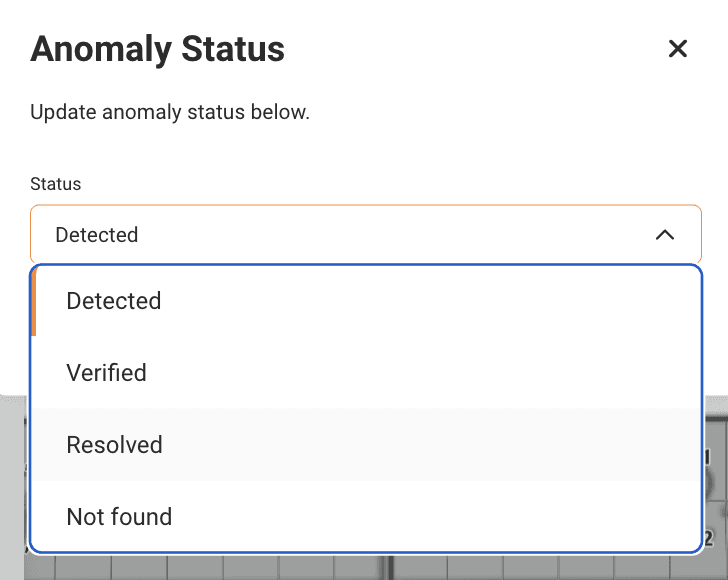
Users can click modules in the map to review details and update the status of each anomaly. Field techs can mark items as “Resolved” to keep the digital twin up-to-date

List View:
Summary findings and cumulative anomaly impacts are displayed in the “List” view


Review anomaly details & locations. Update status by selecting an item from the list
Snap to the selected anomaly in the map by selecting “Map View”

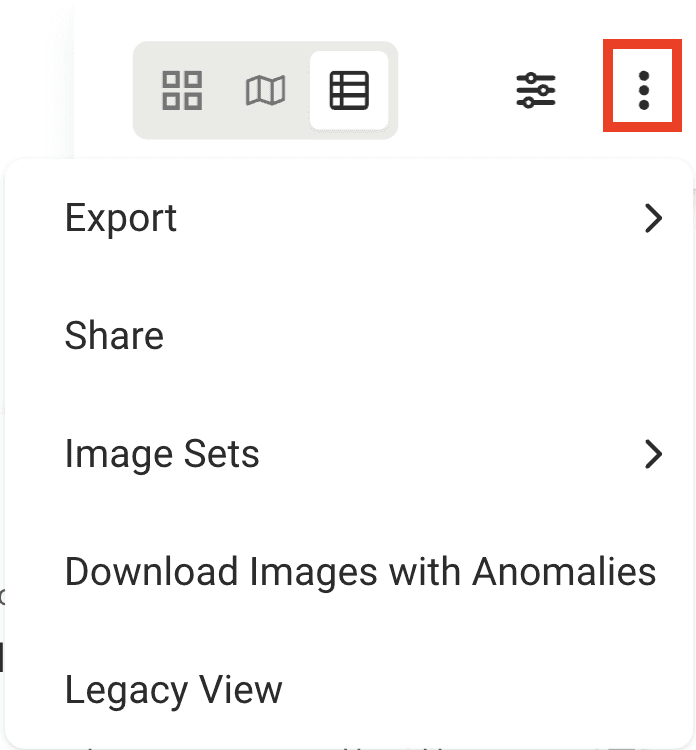
Generate exports and share report access via the “kebab” menu in the upper-right corner
For a narrated walkthrough on how to use the Digital Twin, reach out to support@raptormaps.com.