Solutions

How you benefit

Resources

About

Solutions

How you benefit

Resources

About

/

None

/

Management Decision-Making

Management Decision-Making

Management Decision-Making

Management Decision-Making

Management Decision-Making

Management Decision-Making

Use the Raptor Maps application to assist you as you monitor return on investment or other financial measures for a solar site.

Specifically, you can:

  • Assess the financial impact of defects on power generated by a solar site

  • Distribute the solar-inspection report to others

  • Export the report to a .CSV file to include in more detailed analysis

The following outlines how to use Raptor Maps to review and report on anomalies impacting solar-site power production. The example is based on a Raptor Maps Standard inspection, which identifies anomalies to the diode, hot spot and cell level.

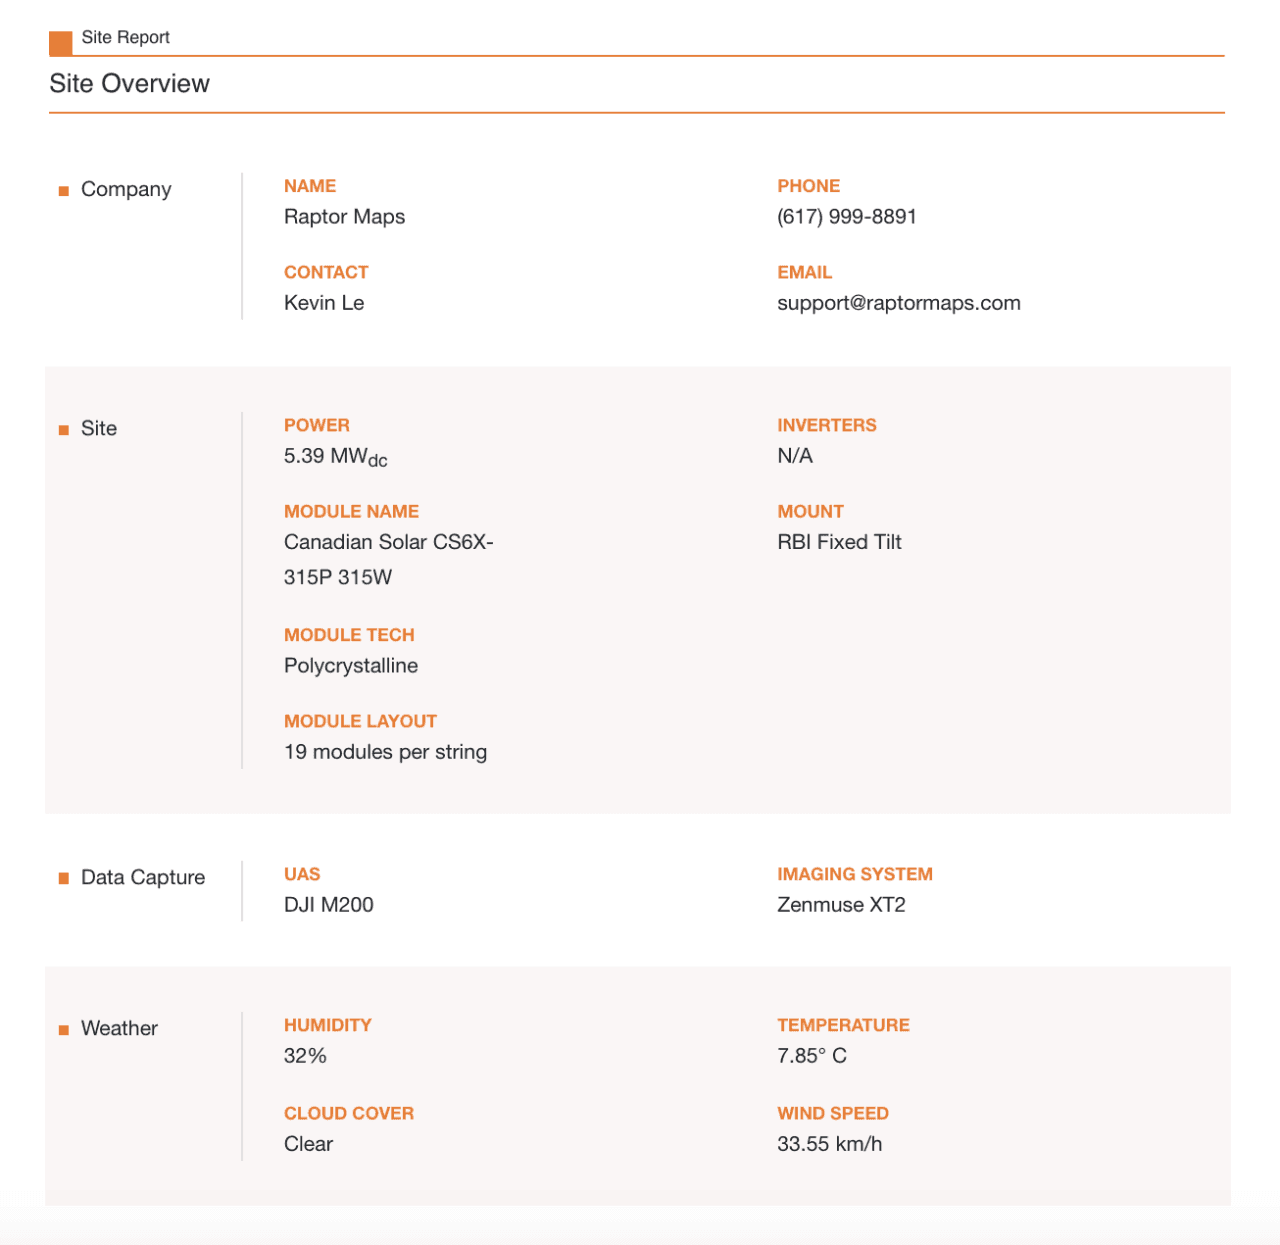
Once your report is available, begin by taking a look at the Site Overview.

This will provide you with context in terms of the site size (in MW DC) and module type:

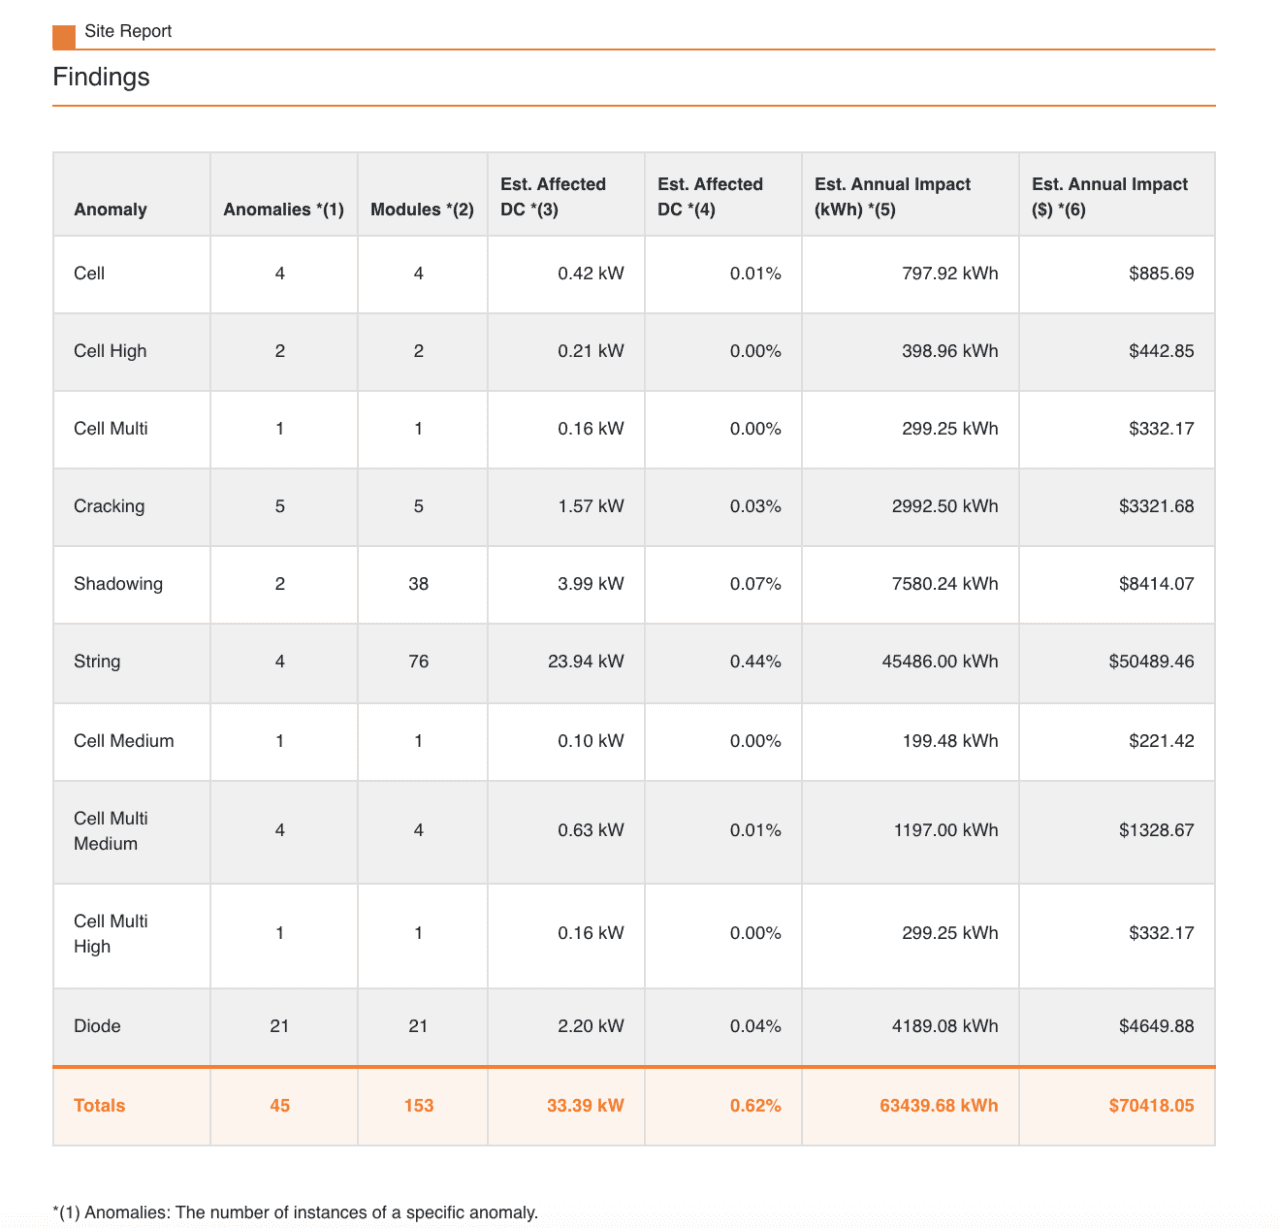
Next, review the Findings table.

This table summarizes the anomalies and estimates the impact of the defects on power generated by the site:

Click on the Options icon from the top toolbar to adjust the values used to calculate the estimated annual and hourly impact:

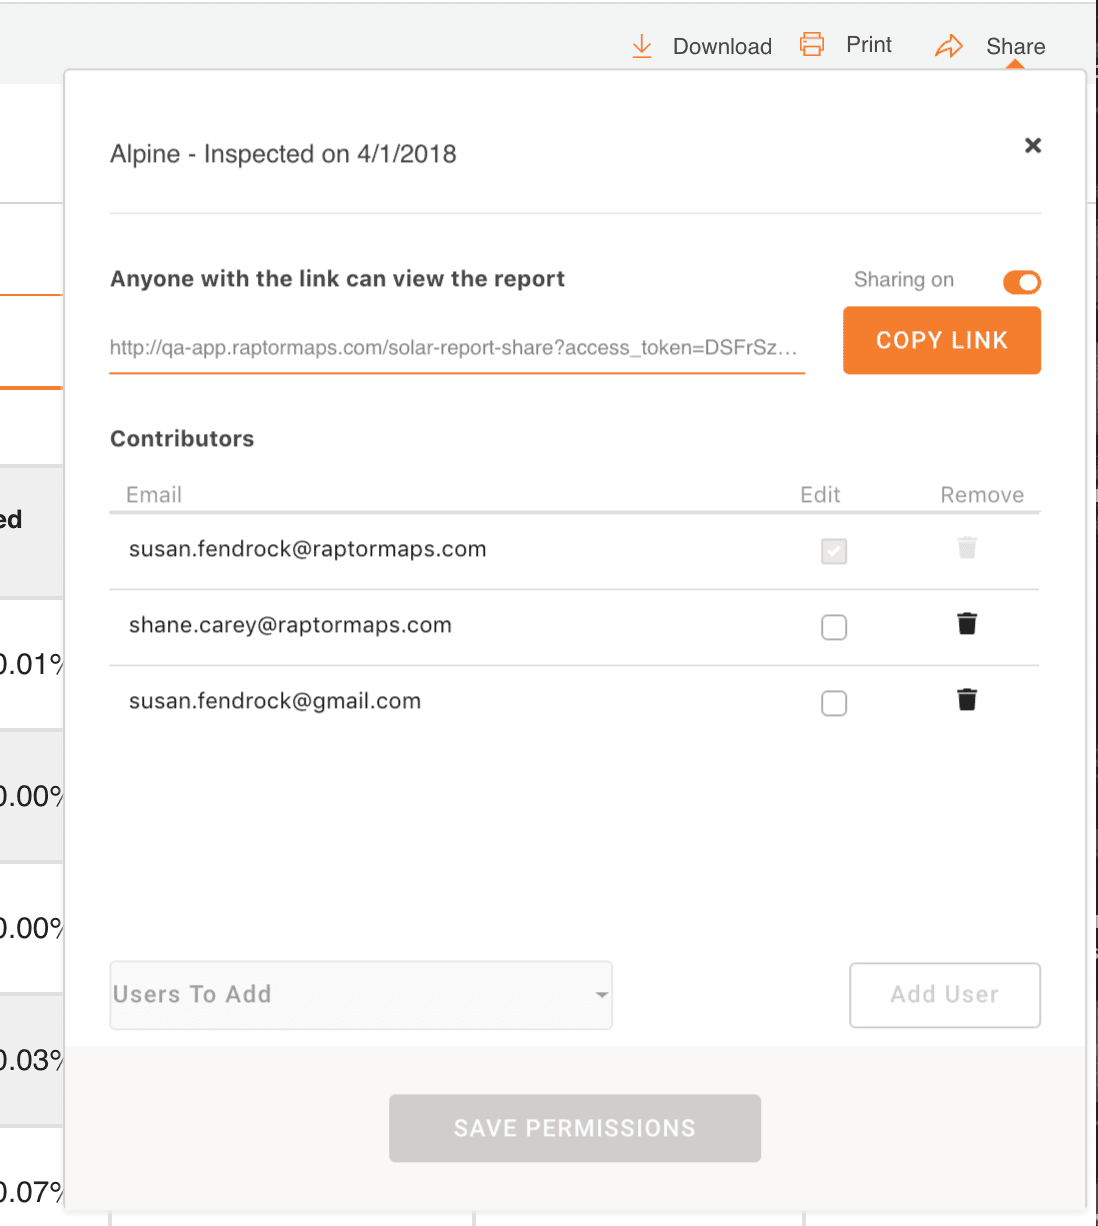
To distribute the report, click on Share from the top toolbar.


Email the link to others provide a read-only view of the report; click on the Sharing on toggle to remove link access to the report:

You can also use the print icon in the top right-hand corner of the screen to print the report to a PDF file. The PDF file will not include the Anomaly location table; you must request this separately using the Send DOCX of Anomaly Locations Report option.

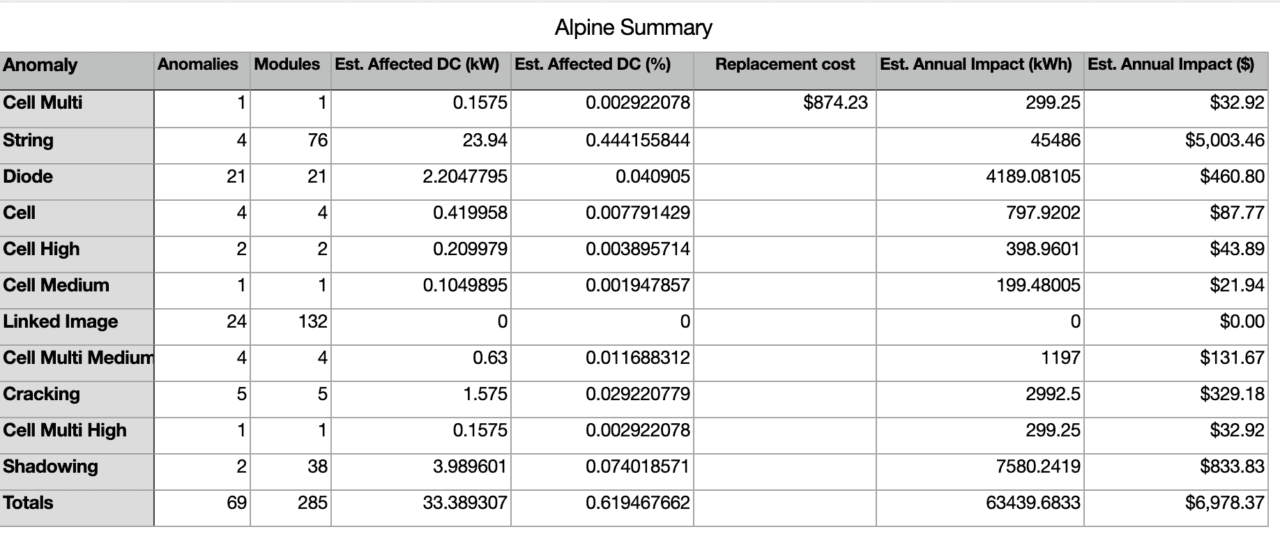
To include report data in other financial analysis, select CSV from the menu of dropdown options. This generates two CSV files, the summary and the detailed findings of your report.

Export the files to Excel or other spreadsheet programs. You can then provide detail to any financial analysis associated with the site inspection.

© 2023 Raptor Maps, Inc.

444 Somerville Ave.
Somerville, MA 02143

Stay Up to Date

Subscribe to our newsletter and stay informed about innovations in solar asset optimization, deploying robotics for solar, our research and testing with OEMs, the latest in our product development, and more.

© 2023 Raptor Maps, Inc.

444 Somerville Ave.
Somerville, MA 02143

Stay Up to Date

Subscribe to our newsletter and stay informed about innovations in solar asset optimization, deploying robotics for solar, our research and testing with OEMs, the latest in our product development, and more.

© 2023 Raptor Maps, Inc.

444 Somerville Ave.
Somerville, MA 02143

Stay Up to Date

Subscribe to our newsletter and stay informed about innovations in solar asset optimization, deploying robotics for solar, our research and testing with OEMs, the latest in our product development, and more.

© 2023 Raptor Maps, Inc.

444 Somerville Ave.
Somerville, MA 02143

Stay Up to Date

Subscribe to our newsletter and stay informed about innovations in solar asset optimization, deploying robotics for solar, our research and testing with OEMs, the latest in our product development, and more.

This website uses cookies

This website stores cookies on your computer to track usage across media in accordance with our Privacy Policy.

This website uses cookies

This website stores cookies on your computer to track usage across media in accordance with our Privacy Policy.

This website uses cookies

This website stores cookies on your computer to track usage across media in accordance with our Privacy Policy.

This website uses cookies

This website stores cookies on your computer to track usage across media in accordance with our Privacy Policy.

This website uses cookies

This website stores cookies on your computer to track usage across media in accordance with our Privacy Policy.